Note: To the EFRA Committee – Reforming the Water Sector.
This content of this page provides input on three specific areas of Southern Water operations, for which Solent Protection Society has significant concerns.
1 – Unacceptable Combined Sewer Overflow discharges into the harbours, estuaries and main water body of The Solent.
2 – Southern Water’s ‘Stormwater Management‘ approach
3 – Southern Water’s ‘Water Resources Management‘ approach
Attached to the letter which accompanies this link, we have also included the Societies response to Southern Water’s ‘revised Draft Water Resource Management Plan’ which details our serious concerns with the company’s strategic proposals for the recycling of final treated effluent from its waste water treatment plants in the south east of England. This response can be opened by taking the highlighted link in this paragraph.
SPS review of four years of Environment Agency CSO discharge data
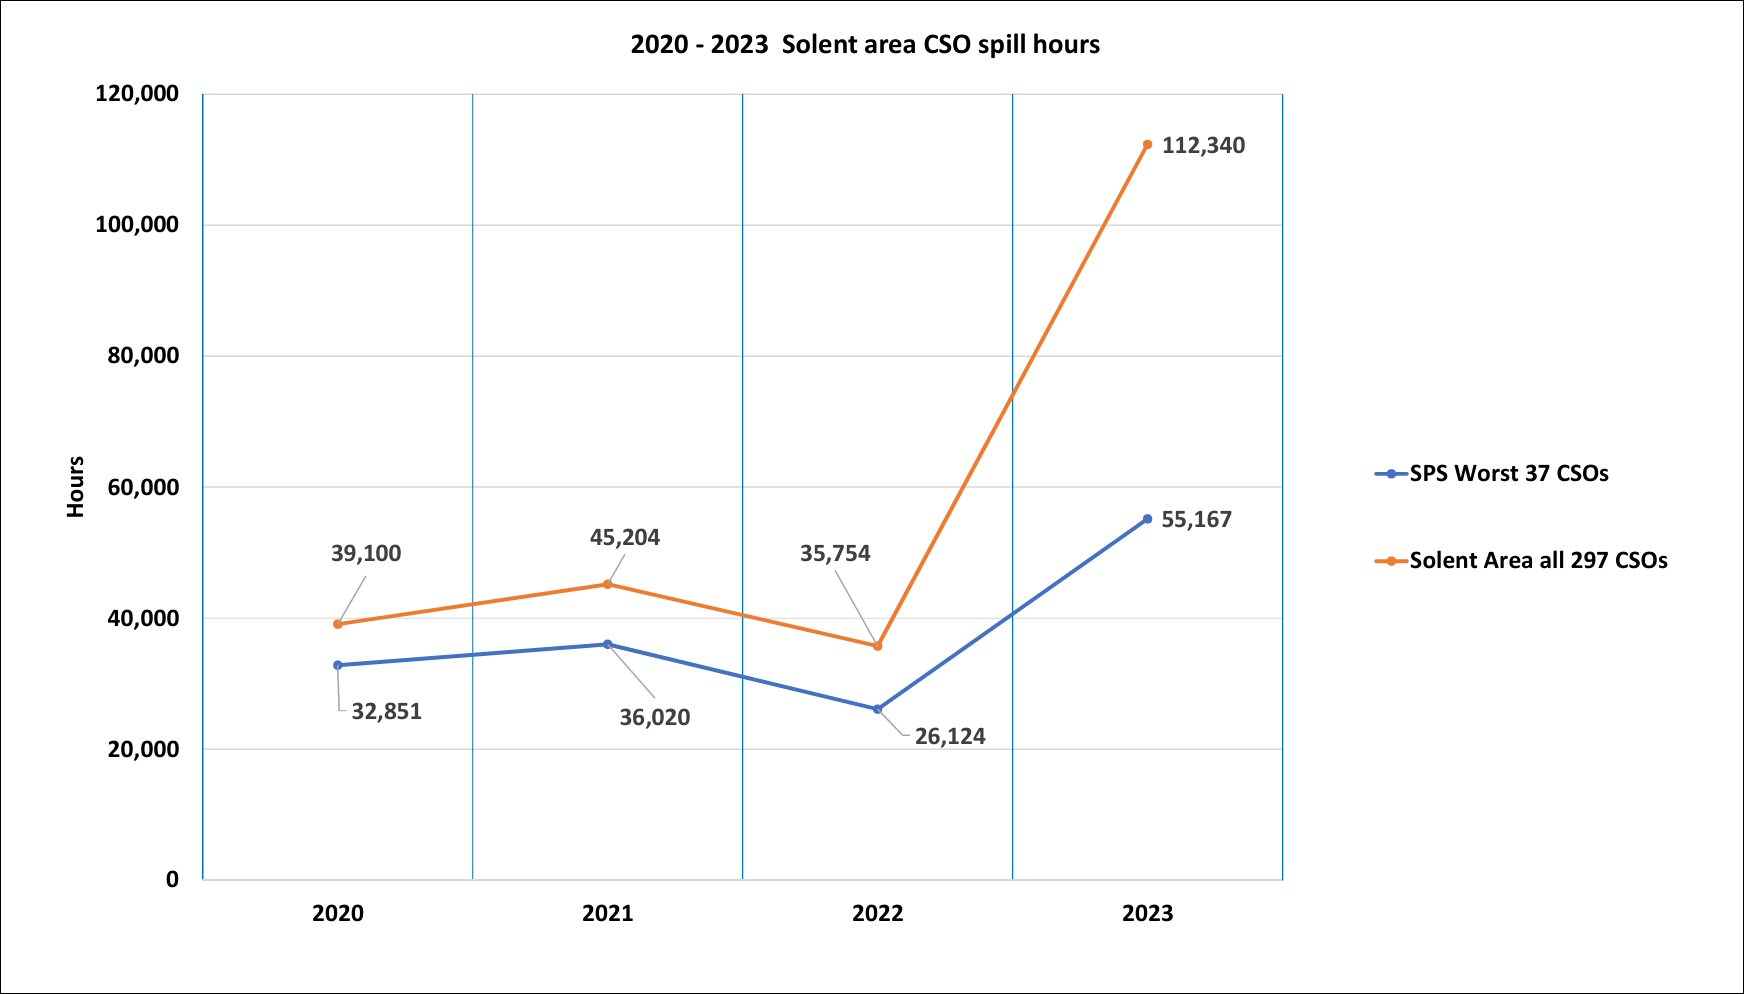
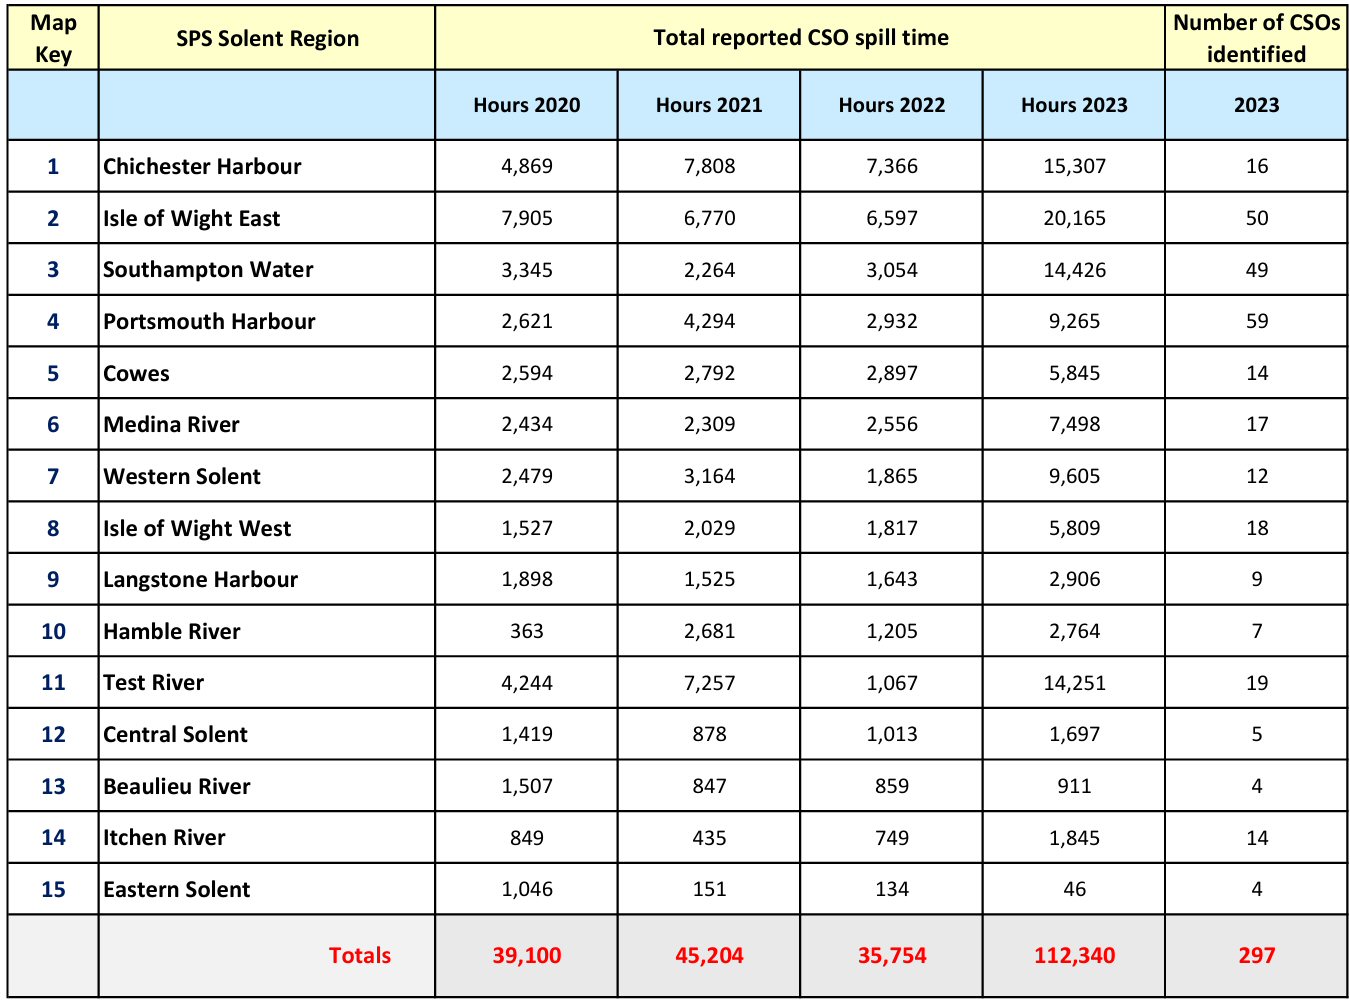
The latest data released by the Environment Agency show that the number of hours of spill from Combined Sewer Overflows (CSOs) across the Solent region increased very significantly during 2023, rising from an average of around 40,000 hours in each of the three preceding years to over 112,000 hours. That is an almost threefold increase.
Analysts at Solent Protection Society have been drilling into the data to see what’s been going on and how the story builds on our previous reports. For the past four years, we have been analysing the discharges reported from almost three hundred individual CSOs around the Solent identified in the data, determining the relatively small number of outfalls that are the worst offenders. In our previous reports, both in 2022 and 2023, we showed how just thirty-seven outfalls were responsible for almost 80% of the total sewage spilled. In each of those ‘worst case’ CSOs, the data for 2023 shows a similar significant increase as we detail later in this post.
It should be noted that SPS generally monitors CSO discharges into the tidal waters of the various rivers that feed into the Solent. However the state of the tide can affect discharges further up the river by holding water back or releasing it sooner. Where there have been significant discharges upstream which could impact the pollution into the Solent these have been included. This particularly affects the River Test into Southampton Water and the River Lavant into Chichester Harbour.
The tables shown in this post refer to ‘SPS Regions’, and to CSO locations within those regions. The fifteen regions noted are shown on the schematic map below, numbered generally by their rank within our ‘worst case’ set.
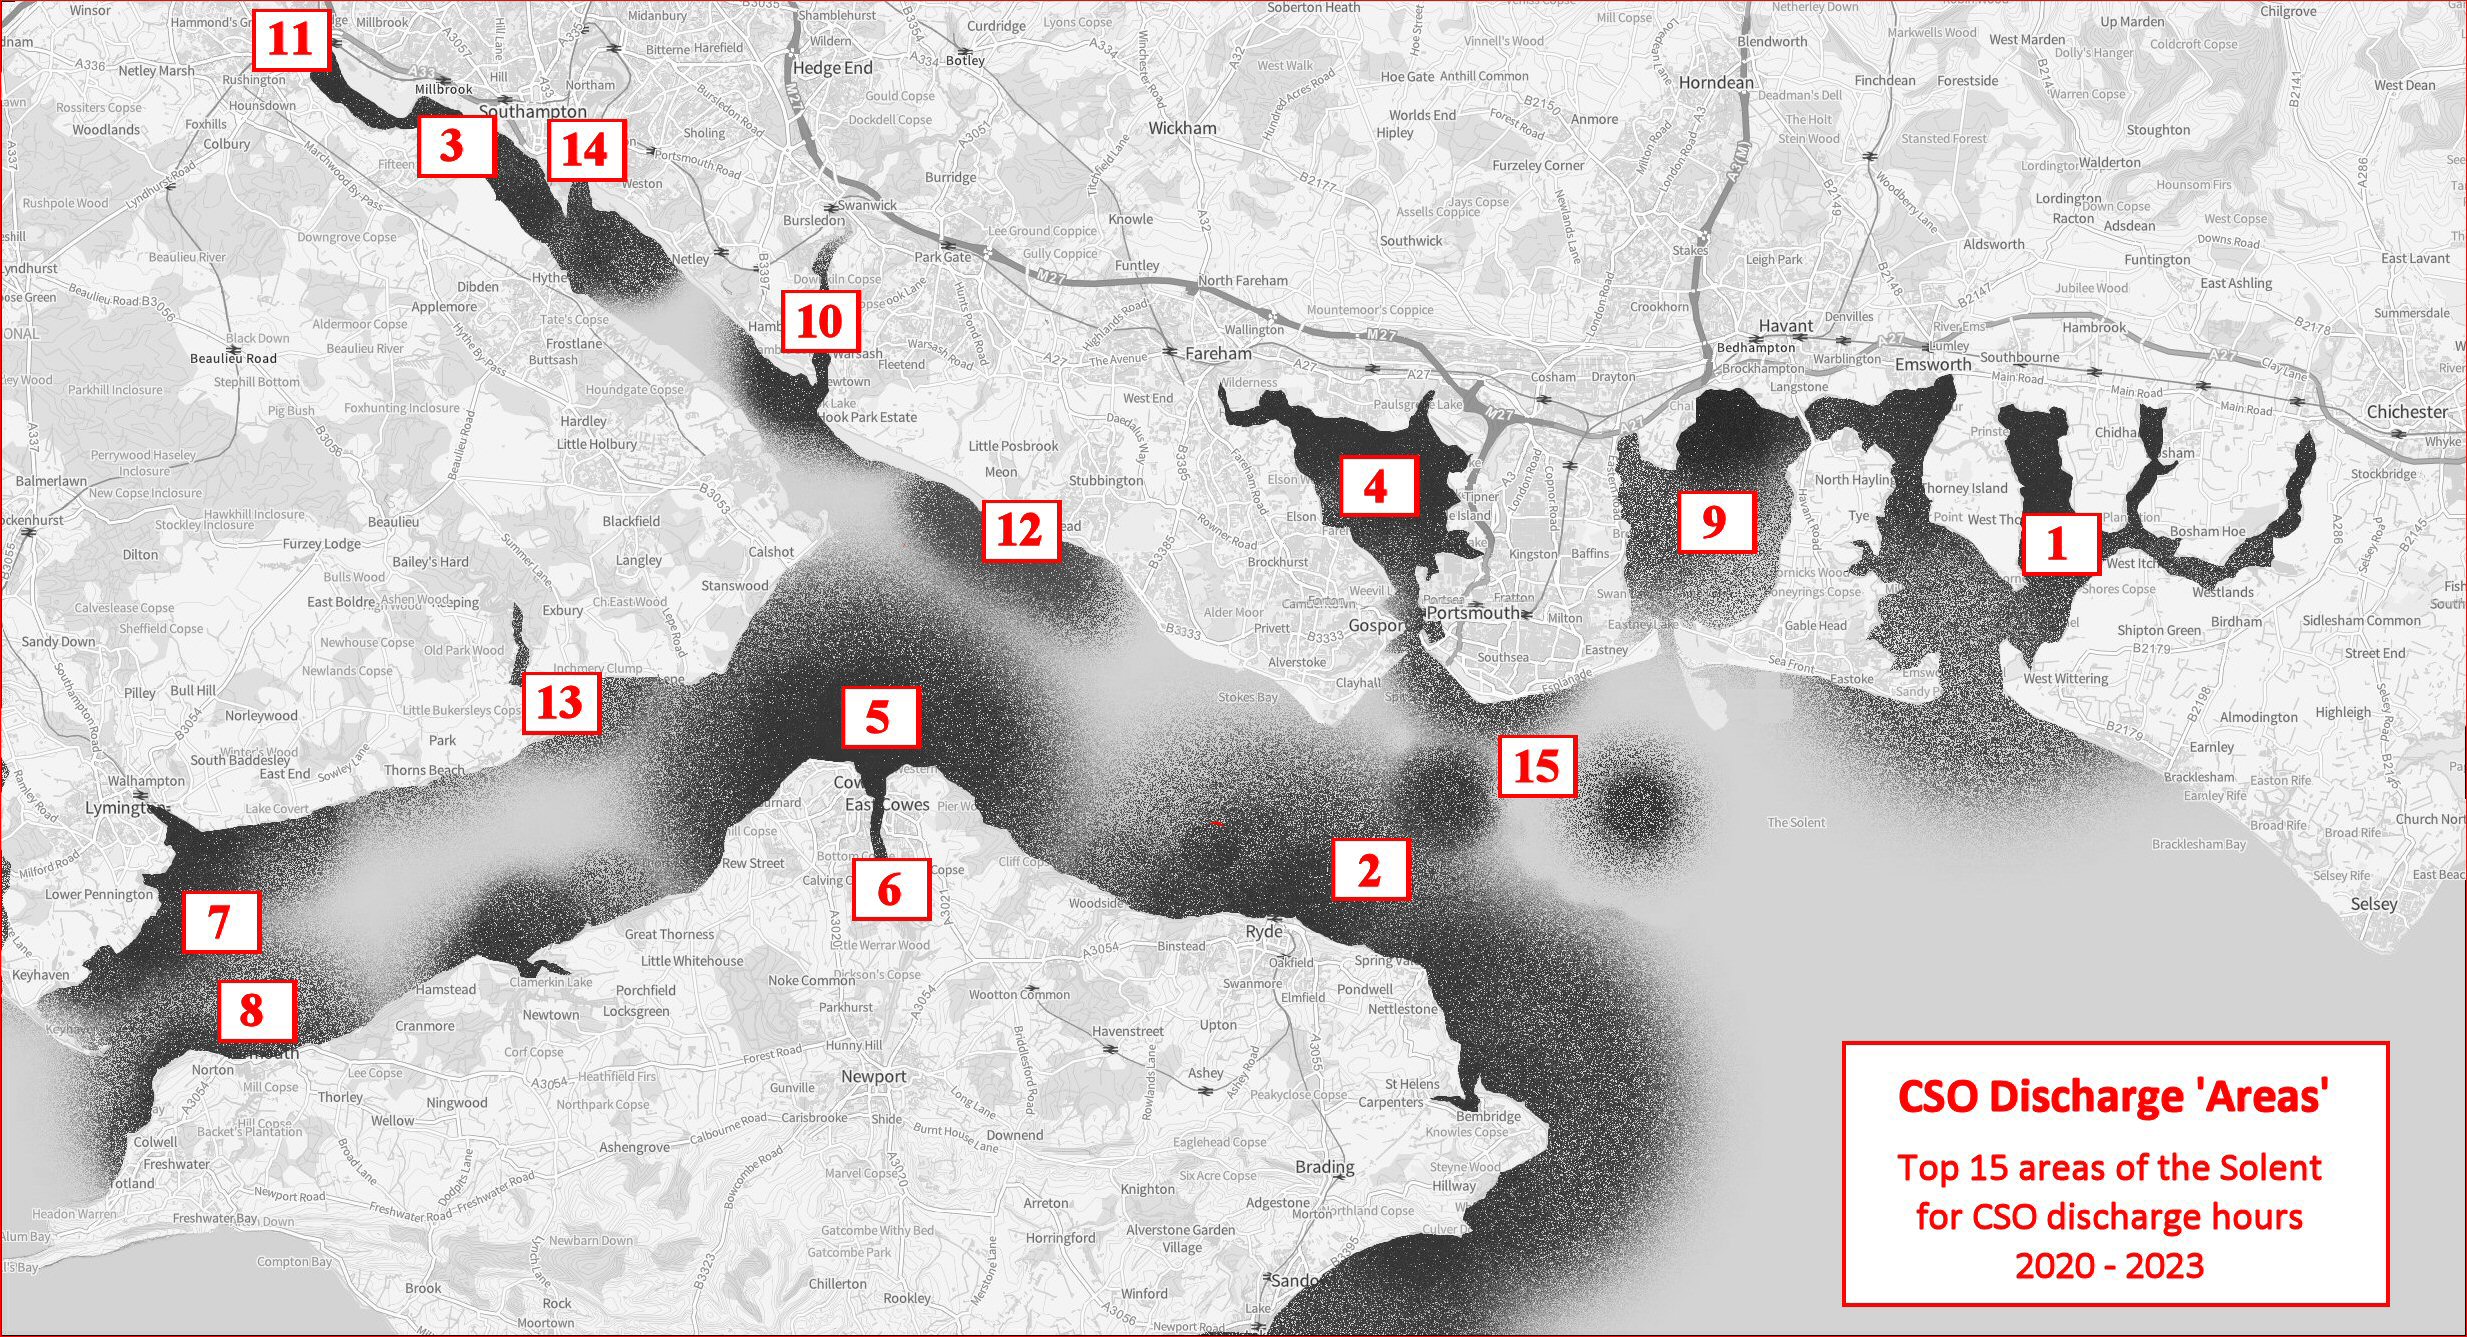
Once again, Chichester Harbour and the eastern Isle of Wight top the lists for the worst performance on CSO discharges. In our analysis, we have grouped the CSO discharge hours from the waste water treatment works (WWTWs) at Slowhill Copse, Millbrook and Portswood under ‘Southampton Water’. While these all flow directly into tidal river estuaries, the principal effect is on the body of Southampton Water.
We’ve brought together our findings from the previous three years and added the new data available for 2023 performance into a single chart below. We’ve broken this down in later charts to make it more readable.
Spillages at the thirty-seven ‘worst case’ have increased from an average of around 34,000 hours to over 55,000 hours, an increase of about 62%, rather less than the increase seen across the Solent-wide figures. There are several likely reasons for this, including the fact that the worst cases were already spilling heavily.
The increase in rainfall affecting the 2023 data has clearly resulted in an increase in the number of ‘worst case’, with the discovery of new offenders which had previously not been significant in the data. We discuss this further below.
Breakdown of CSO spill events at all identified CSOs across the Solent
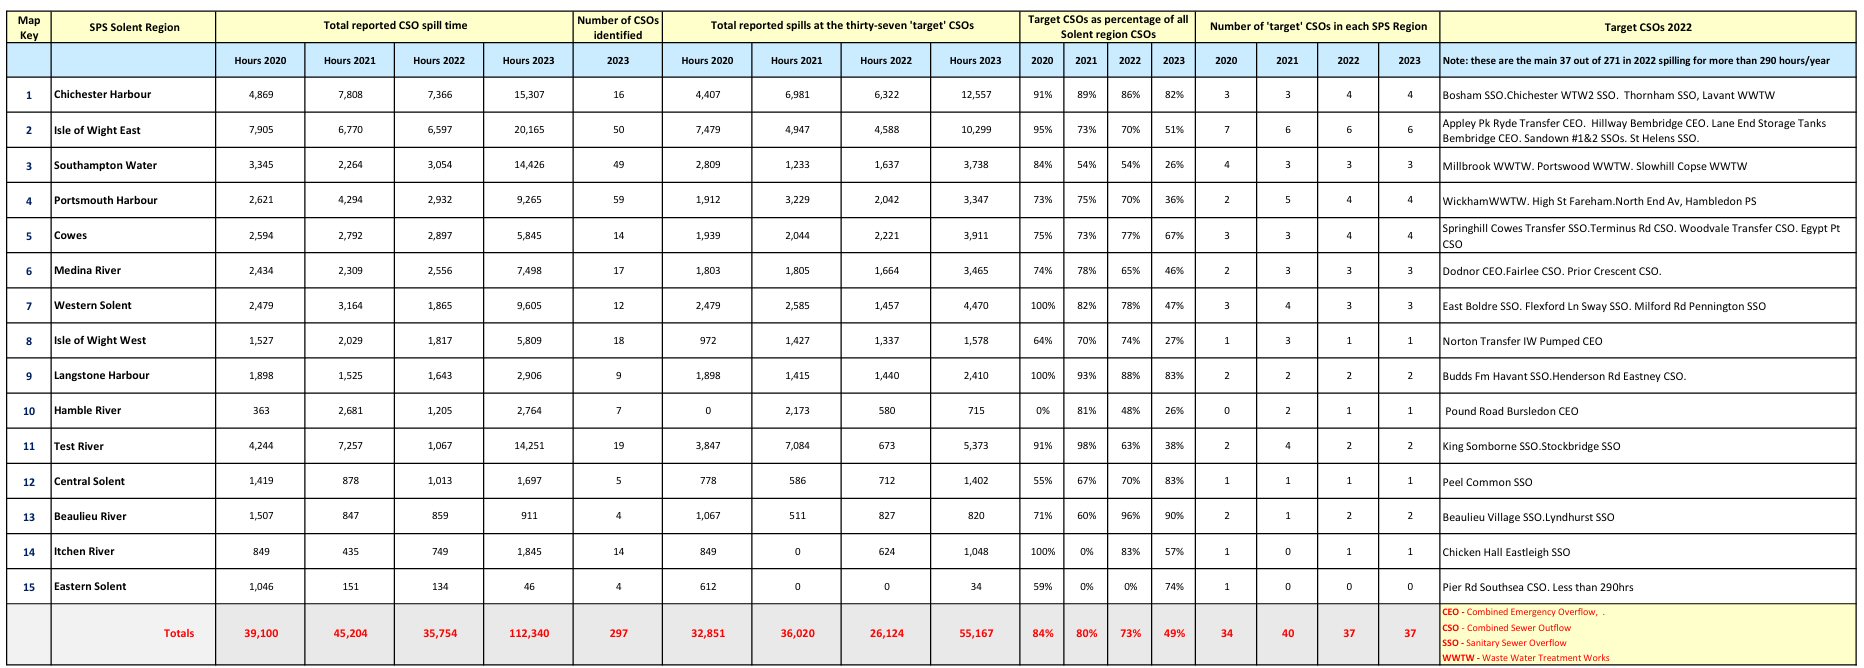
This first chart presents a set of Solent ‘SPS areas’ into which we have geographically grouped all of the CSOs identifiable in the Environment Agency data. The total number of hours of spillage is shown within each region by year, together with the sub-total number of CSOs within the area.
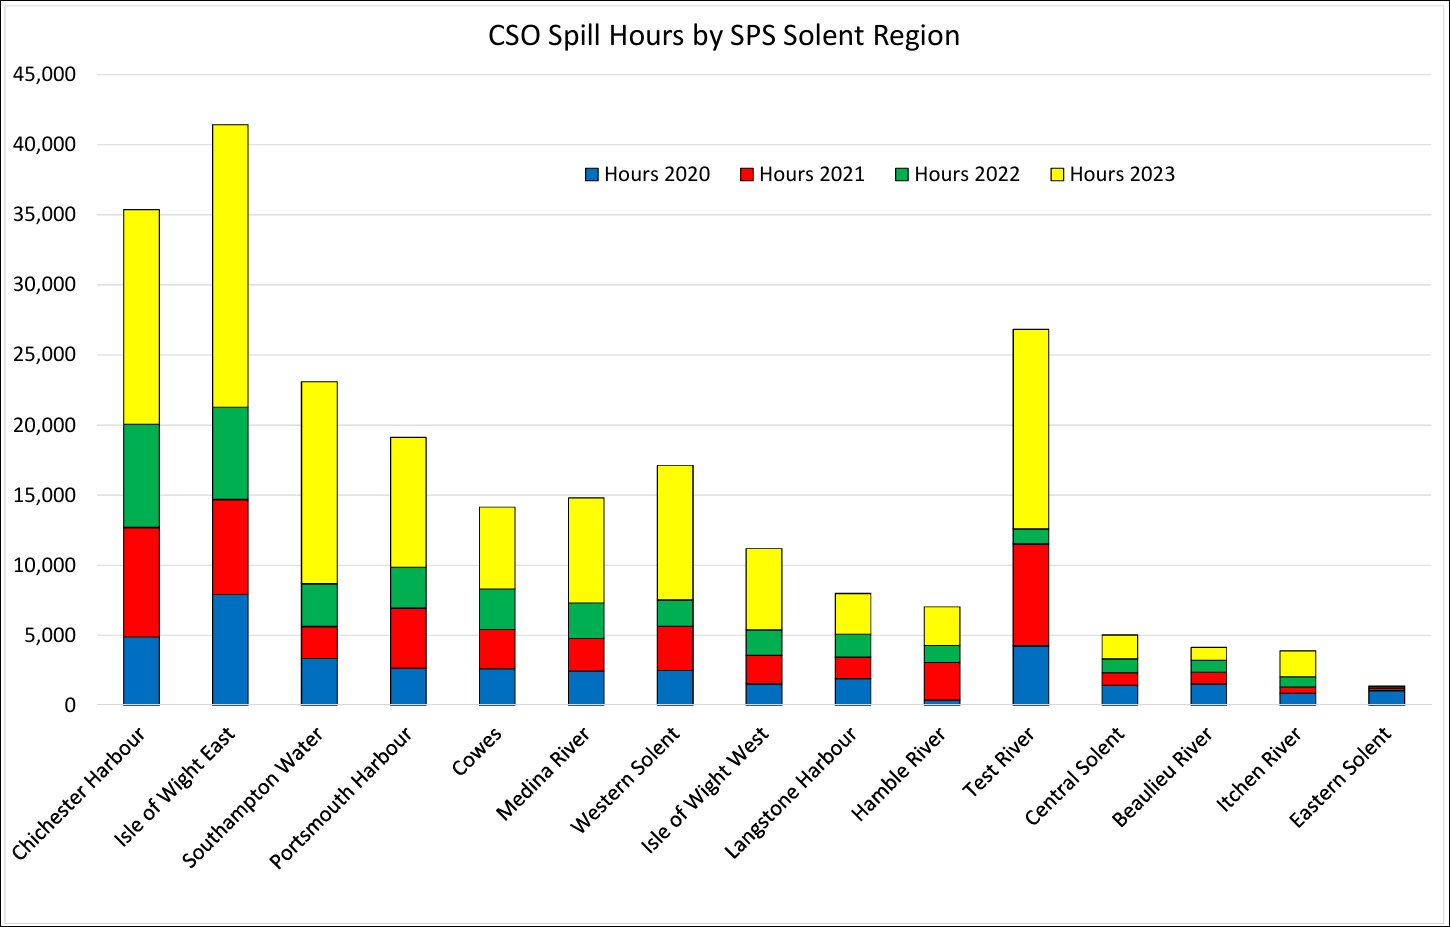
In the following chart, the data is presented in ‘stacked’ form, with the cumulative annual discharge displayed by each area highlighting the significant peaks at the Isle of Wight, Chichester Harbour and the River Test.
Breakdown of CSO spill events at the SPS ‘worst case’ CSOs across the Solent
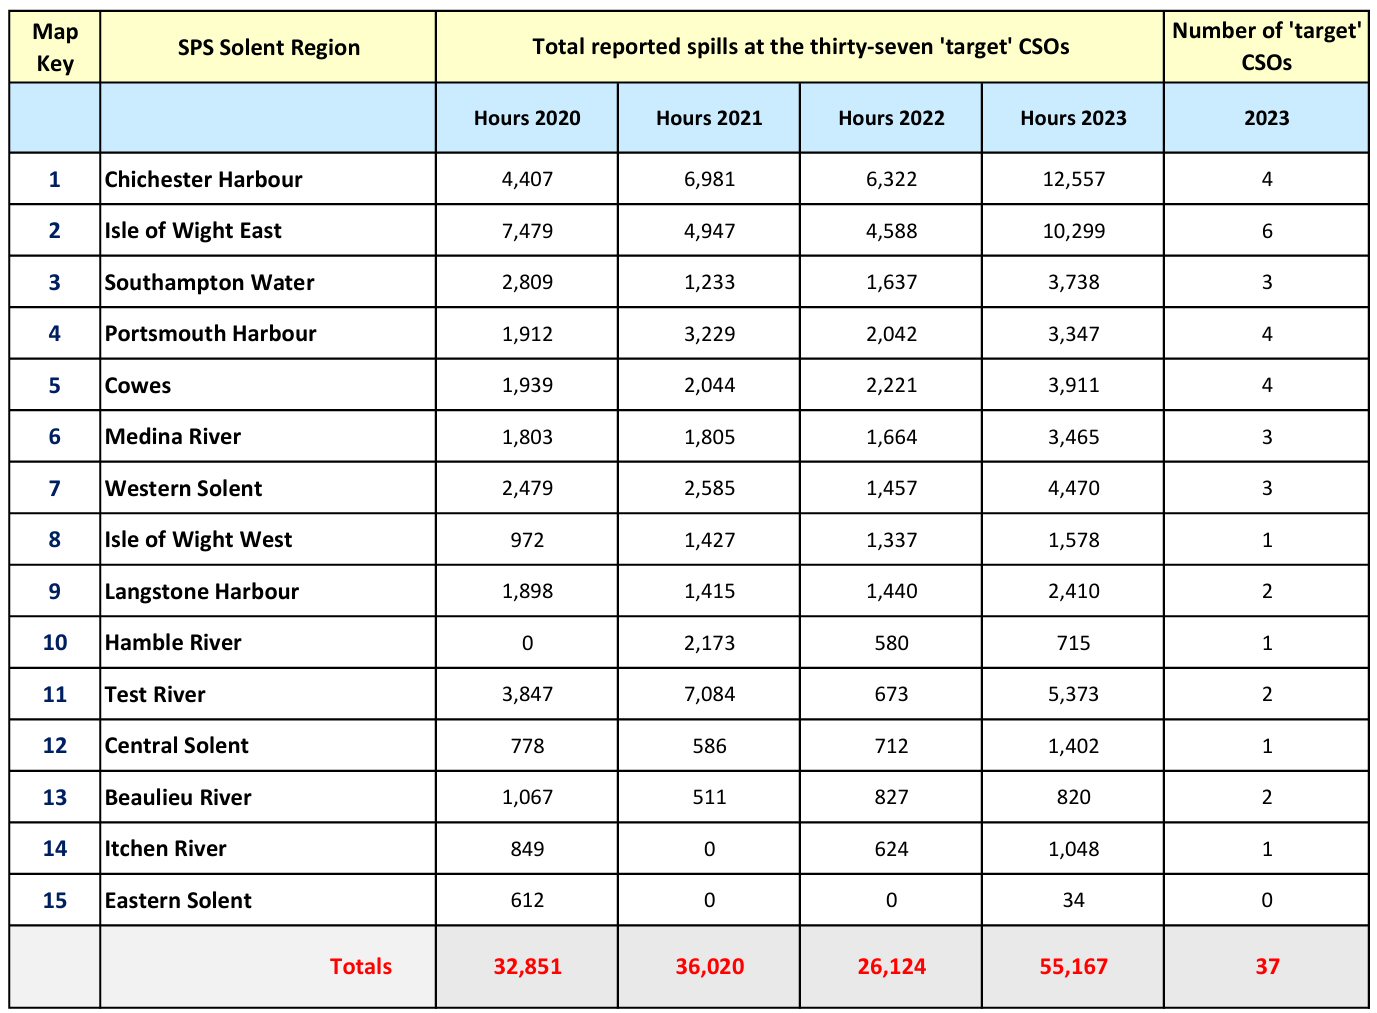
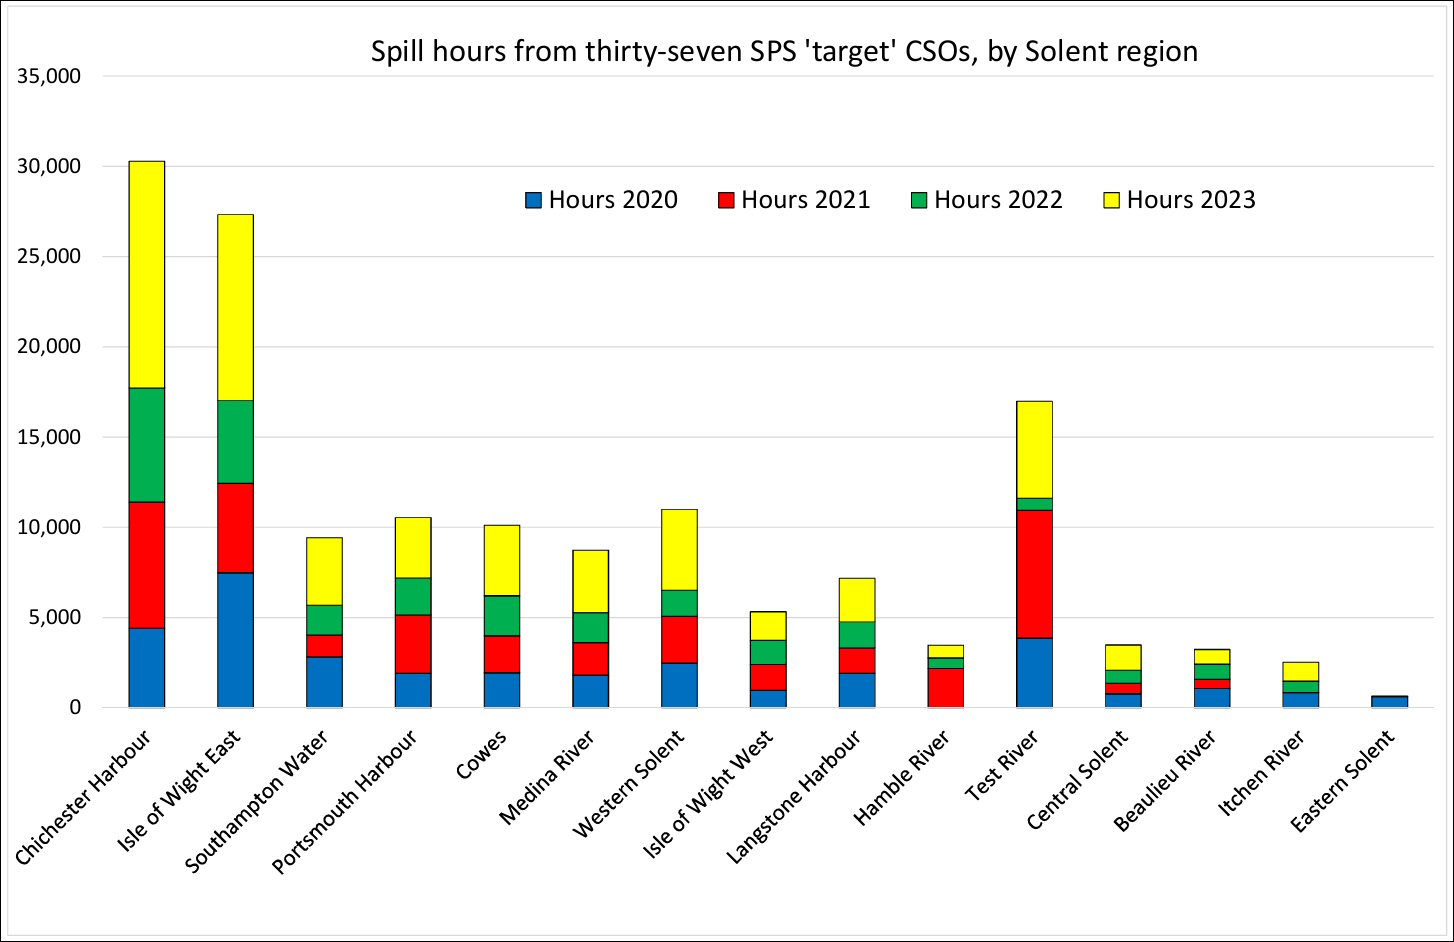
Looking just at the thirty-seven ‘worst case’ CSOs shows a rather different picture, with discharges into Chichester Harbour taking line honours over the eastern Isle of Wight. However, the Isle of Wight as a whole falls into the Sandown WWTW catchment and forms 35% of the worst case total Solent spills, with Chichester Harbour accounting for 23%. Between them, the fourteen Isle of Wight worst case CSOs and the four Chichester Harbour worst cases account for almost 60% of our total of the worst case CSO spills into the Solent.
As with the previous chart, the total number of hours of spillage is shown within each region by year, together with the sub-total number of CSOs within the area. Notice that we define the ‘worst case’ CSOs as ‘Targets’ in the following charts, suggesting that they are the ones for which remedial action would offer the greatest benefit.
And again, the same data displayed as a stacked bar graph:
The SPS Solent ‘Target CSOs’ – Four years of data
The next chart identifies the worst case CSOs in the right hand column. Note that the fluctuation in the number of target CSO’s identified in any one year results from assumptions we’ve had to make as some CSOs fall above or below the threshold of 290 hours per year we used in the Environment Agency annual publication.
As we explain in the ‘Background context’ section at the end of this post, the substantial increase in spills across the board in 2023 meant we have opted to retain the previous year’s thirty-seven ‘worst cases’ to maintain our comparison with the earlier years.
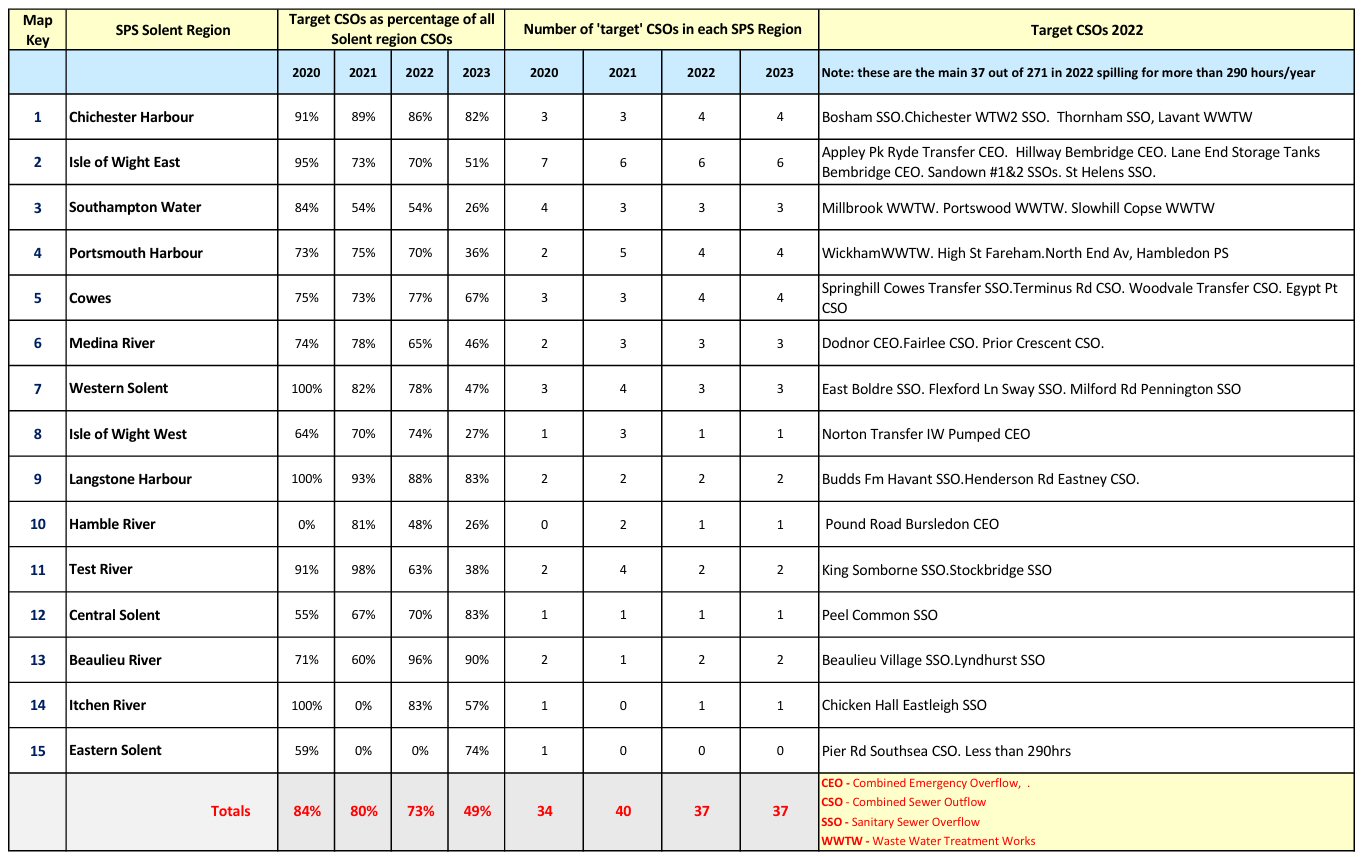
The percentage given in the chart is the relationship between the thirty-seven worst case hours and the total hours. It can be seen how the thirty-seven or so worst cases total an average of around 80% for years 2020-2022. That percentage drops in 2023 to just under 50% due to the exceptional spike in the data from a similar number of previously insignificant CSOs. That lower total of 49%, however, still shows that almost half of the total Solent spill duration comes from little more than a tenth of the CSOs discharging into the Solent.
Background context
Our aim, using Environment Agency data, has been to present a high level view of the ‘worst’ performing CSOs, our ‘targets’ for improvement, across the region. In doing this, we have demonstrated that the bulk of the discharge duration into the Solent results from a relatively small number of outfalls. Our benchmark for that number was initially set at 290 discharge hours per year, to generate a manageable number of ‘targets’ for presentation. For the first three years, that number fluctuated between 34 and 40, with a common set of thirty-seven ‘worst cases’ appearing; just over 10% of the total number of CSOs identified as discharging into the Solent.
The exceptional rainfall levels of 2023 triggered high discharge rates at previously insignificant CSOs, increasing the number of ‘worst case’ CSOs to around eighty above 290 hours/year. So to maintain the overall four-year comparison in this post, we have simply retained focus on the earlier thirty-seven.
It is important to bear in mind that water companies are not currently required to report either actual or estimated volumes of CSO discharges. The only data available relates to the date, start time and duration of a spill event. As has been widely publicised in the media, this could significantly under-call the actual scale of the discharge problem.
As far as possible we have tried to verify the Environment Agency data but there may be minor discrepancies, particularly if CSO names have changed, however we believe the overall trends are clear.
Stormwater management by Southern Water
Stormwater is rainwater that is not absorbed into soil, flowing rapidly downstream and increasing the level of waterways and consequent volume in drainage. The significant increase in rainfall during 2023 reminds us that changes in rainfall patterns are expected in the coming years as a likely consequence of climate change. On many days, the rainfall in 2023 was exceptional, continuing over extended periods and resulting in saturated ground conditions. At these times, the rainwater entering the sewerage system has completely overwhelmed the capacity to cope, leading to many more hours of spill.
The Southern Water Pathfinder projects
We have learned through monitoring the Southern Water Pathfinder projects that it is not simply stormwater run-off that is entering and overloading the sewerage system. There is also a significant volume of groundwater entering the system below ground, through vulnerable joints in the pipes. The significance of this previously unrecognised inflow will have further implications on the way in which the problem of excessive CSO spills should be tackled in the coming years.
The Southern Water ‘Pathfinder’ projects are a set of trials being undertaken by the company to measure the effectiveness of different approaches to managing the influence of rainwater on the sewer network as well as maximise the network’s capacity, where possible. SPS has been closely monitoring the Isle of Wight pathfinder. For further details, take this external link.
Portsea Island stormwater management
It is, of course, possible that the reduction in significance of some of the original thirty-seven ‘worst case’ CSOs may reflect actions that have been taken by Southern Water. The locally infamous ‘Pier Road Southsea’ CSO in Old Portsmouth, has not exhibited significant spills since the 2020 data. However, given its position at the southern end of the densely populated Portsea Island, we continue to monitor it closely.
For the past four years, the nearby Pier Road pumping station has been under constant remedial action and during 2023 was the site of a massive pipeline operation with daily road tanker removals to Budds Farm wastewater treatment works at Havant. Despite repeated requests, no explanation for these works has been forthcoming from the company.
The ageing Victorian sewer network
Southern Water are making increasing use of emergency powers to expedite essential maintenance on older urban areas of the network, particularly in towns and cities such as Ryde and Portsmouth. Road closures on Portsea Island for sewer relining and reconstruction are becoming increasingly common, and when one of the only three routes into the city is affected, there is a significant peak time impact on traffic throughout the surrounding road network.
Use of the long sea outfalls for stormwater discharges
The analysis SPS has undertaken assumes that when long sea outfalls discharge as a spill in Environment Agency data this is a combination of treated or untreated sewage and rainwater. Southern Water has considered the option to switch the routing of treated effluent and stormwater overflows between the Budds Farm CSOs into Langstone Harbour and the Eastney long sea outfall, but we suspect that more research is needed into the environmental impact of flow from long sea outfalls. Appley Road at Ryde has a long sea outfall into the eastern Solent but being remote form a wastewater treatment works is clearly untreated. Sandown, like Budds Farm on the mainland, is a treatment works with an associated long sea outfall.
Southern Water’s approach to Water Resources Management
As climate change progresses, rainfall patterns in the UK are expected to undergo significant changes. A summary of the key trends, as viewed by the UK Meteorological Office, shows that the UK is projected to become wetter, with an overall increase in annual rainfall. The frequency and intensity of heavy rainfall events are expected to rise, with more frequent and intense downpours leading to a higher risk of flooding; winters are likely to become wetter, while summers may become hotter and drier, resulting in more intense storms in both seasons.
It is worth noting that in the UK, less than 4% of annual rainfall is captured and stored for public water supply, a figure that might appear surprisingly low given our recent experience of torrential downpours and local flooding. We might therefore expect the UK water companies to be focusing on a portfolio of strategic options for future water supply which use capture and storage programs involving the construction of large general reservoirs, networks of smaller winter storage reservoirs and more comprehensive management of existing, new and previously-mothballed aquifer storage sites.
The consultation on Southern Water’s revised draft Water Resources Management Plan closed on 4 December 2024, for most of the company’s customers as quietly as it had begun. Southern Water has never taken the opportunity of using its regular billing communications to inform customers about upcoming plans, instead leaving its customers to learn the importance of these strategic consultations by word-of-mouth from other public sources.
It should be noted that Southern Water’s rdWRMP consultation document library comprised 32 published documents and a further 12 documents restricted from public view for questionable reasons of ‘commercial confidentiality’ or ‘national security’. The full list of documents, including a significant supporting spreadsheet only visible with the restricted documents set, is visible by clicking this link.
Having had sight of the restricted document set, the SPS Vice Chair believes that an accurate assessment of the rdWRMP cannot be made from the published documents alone, hence request in the Society’s response for DEFRA to sponsor a comprehensive and independent audit of the full document library.
Southern Water’s strategic option for future drinking water supply
Southern Water’s latest ‘revised draft Water Resources Management Plan – rdWRMP’ has deferred further analysis of the ‘nature-based’, environmentally sound, sustainable and cost-effective options outlined earlier, until a future revision of its WRMP in the hope that its latest strategic options will have been approved by the Secretaries of State and would be well into delivery by that point.
So what are Southern Water’s strategic options?
The primary strategic option for future water supply is the delivery of four advanced sewage effluent recycling plants built as extensions of the Company’s waste water treatment plants at Sandown IoW, Budds Farm in Havant, Littlehampton in West Sussex, and further afield at Horsham, also in West Sussex. A recent BBC South Today article entitled “Toilet to Tap” on the Sandown recycling plan in which Tim McMahon, Southern Water’s ‘Director of Water’, described the “Sewage Treatment Effluent Recycling”. You can view that BBC article, together with our ‘Fact check’ response, in a previous SPS article which you can read by clicking this link.
The secondary strategic option is frankly extraordinary, clearly intended simply to reinforce the argument for its primary option. Southern Water has drawn up contingency plans to import water from Norway by tankers to a Southampton port facility from where it would be pumped along a temporary pipeline beside the River Test to a local storage lake pending further treatment. The plan would see up to 45 million litres of water shipped to the UK per day. This water would, by virtue of its geological source, have a completely different chemistry to that of the River Test.
The Capital Expenditure (CapEx) trap
The UK water industry operates under a system where companies earn returns on their investments based on their regulated asset base. This incentivises large capital projects because the more capital a company invests in infrastructure, the larger the asset base on which they can earn regulated returns. For that reason, politicians and regulators often prefer high-profile infrastructure projects that can be seen as decisive actions to address water scarcity.
Southern Water’s preferred strategic option is outrageously expensive, with the proposed Havant Budds Farm effluent recycling plant and its linking infrastructure to the Otterbourne water treatment works alone, currently costed at £1.2bn – £1.4bn to build plus a further unpublished significant amount per year to run. By way of contrast, Portsmouth Water’s Havant Thicket Reservoir is currently costed at £350m to construct with relatively low on-going running costs, and a 200 year life expectation. (Solent Protection Society members will already have seen an article on the unfortunate connection between the two companies in our recent printed Newsletter.)
Unfortunately, Southern Water is no exception to the alarming and much publicised state of debt in which the UK privatised water companies find themselves, and since routine emergency and maintenance costs are handled separately, preventative maintenance is rarely prioritised.
Southern Water are not permitted to make a profit on routine or emergency maintenance activity and do not therefore prioritise preventative maintenance, so without profit, investors have little interest in such activity. It is, as the recent double pipe burst (Ryde and Old Portsmouth) shows, nevertheless essential. And that’s not all, the Company currently loses around 100 million litres of water every day to leaks, that’s 19% of the water they treat. Southern Water’s slow programme for improvements mean that even by 2050 they will still be losing about 10% of all the water they treat, and that’s including the “new water” manufactured at huge cost from their planned new effluent recycling schemes.
Since the source for the primary strategic option for ‘new water’ for the Solent area would be the treated sewage effluent from Budds Farm WWTW and Sandown WWTW, it is alarming to see the fragility of these sources highlighted so vividly in December 2024 by the ongoing bursts affecting main sewers supplying both sites.
See this separate SPS article for details.
Incorrect classification of the HWTWRP project on the Nationally Significant Infrastructure Project database
Not content with just refusing to disclose essential information in the rdWRMP Consultation, it appears that Southern Water is also misleading the UK Gov Planning Inspectorate by its application for NSIP acceptance.
Analysis of the currently available NSIP project register (December 2024) shows the HWTWRP project recorded under Application Type ‘WA01 – Dams and Reservoirs’. The project actually has two clear components, the first being a new advanced effluent treatment stage at Budds Farm WWTW, the second being a 40+km water transfer pipeline project to move output from the proposed recycling plant to the Otterbourne WTW. There are two very clearly defined NSIP Application Types which would more accurately define these sub-projects, ‘WW01 – Waste Water treatment works’ and ‘WA02 – Transfer of Water Resources’.
The only association that Southern Water’s HWTWR project has with a ‘dam’ or a ‘reservoir’ is in Southern Water’s desired change of use for Portsmouth Water’s already approved and under construction Havant Thicket Reservoir, to provide the essential environmental buffer component for its Budds Farm recycling proposal.
This proposed change of use is hotly disputed by local residents, environmental groups and Havant Borough Council whose planning services team approved the reservoir construction exclusively for the storage of raw water from the local Havant and Bedhampton chalk springs. Solent Protection Society shares these concerns, as we outlined in our response to the rdWRMP.
It looks very much to the Society that Southern Water is simply trying to ‘fast track’ its Hampshire project through the National Infrastructure Planning system by registering the two controversial components as an attractive ‘Dam’ or ‘Reservoir’ project, presumably in the hope of securing a fast path through the system.

 Solent Protection Society