
Introduction
In last year’s newsletter we published an article explaining some of the science and assumptions about sea-level rise and flood maps. This year we will try to bring it nearer to home with some advice about how worried you should be if you live near the coast.
There have been many articles in the national press suggesting things like “200,000 homes and businesses in England could be completely submerged in water by 2050”. There are about 24 million houses in England, so this represents 0.8%, though is obviously significant if you live in one of them.
How do I find out if my house is at risk?
Before going into much detail, it is good to understand the various different risks
- Coastal erosion – Naturally coasts change, being eroded in some places, and accreting in others. Natural erosion will increase with climate change, both due to sea-level rise and increased storminess. If you live near an eroding coast, it is important to know whether it is natural, or whether there are sea-defences to reduce the rate of erosion.
- Tidal Flooding – Tidal flooding occurs when a combination of astronomical (predicted) tide and storm surge (caused by weather conditions) and in some cases wave action, occurs. As with coastal erosion it is important to know whether the coastline is natural, or whether the risk of flooding is managed by sea-defences.
- River flooding – River flooding generally occurs when the flow in the river is greater than the capacity. The capacity may be natural or artificially managed and where the river meets the sea, as in an estuary, there is a complicated interaction between the river flow and the tide.
- Flooding from other sources – Flooding can also occur from a variety of other sources, drainage problems, groundwater or burst pipes. In general, these are less predictable and usually, but not always, less serious.
In order to check the risk in a particular area there are a series of maps and other details on the government website, most of these are derived from Environment Agency data. The maps all differ slightly and are worth comparing since they serve different purposes. We discuss them, with links, below.
Flood Maps
Flood maps available on the GOV.UK website. This link to UK Government’s Environmental Management site gives access to most of the information and we will try to explain the differences.
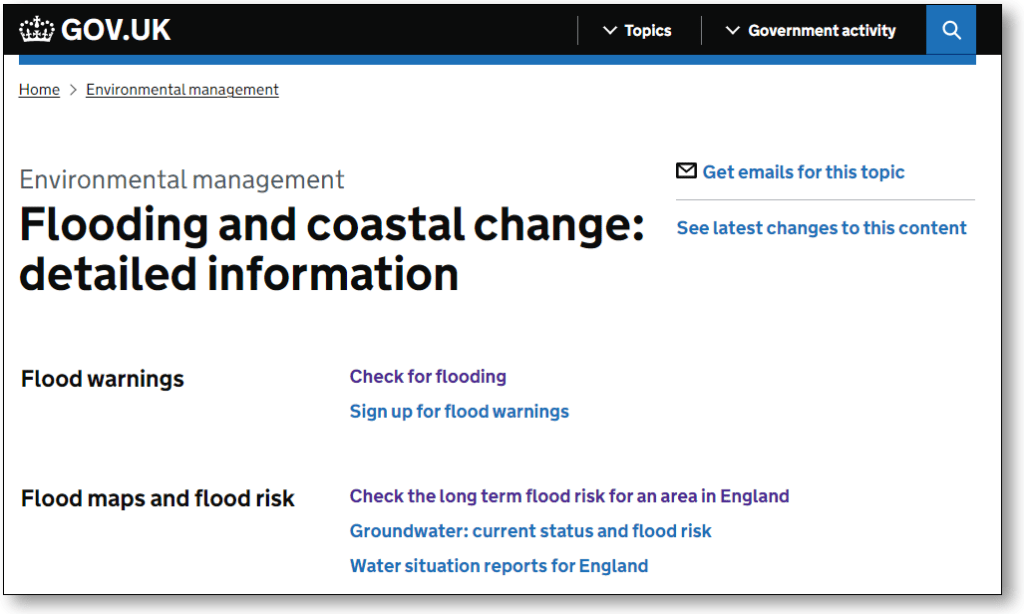
If you click on the image above, the website page will open in a separate browser tab. Scrolling down the page, you’ll see a list of topics in black, and to the right a list of related links in blue text. We show a few of the main topics of interest below.
Flood Warnings
This gives you information about current flood warning in an area and allows you to sign-up to the flood warning service that can alert you if a flood alert or warning is issued for your area of interest.
Flood Maps and Flood Risk
This is perhaps the most useful part and gives you a link to the long-term flood risk in a particular area. These maps take into account predicted sea-level rise and are the best way to find out if there are risks in a particular area.
Groundwater flooding is not generally a problem near the coast, but it is in the chalk hills in Hampshire and Sussex. Most of the other links are of general interest but the links beside the topic Flood Defence Schemes, particularly in the Solent and South Downs Area are helpful to let you know if there are any proposals nearby.
Other Flood maps
Planning
Elsewhere on the GOV.UK website there are other maps available. The UK Flood Map for Planning takes you to information about development in Flood Risk Areas. Click the image below to open the site, then follow the instructions on screen.
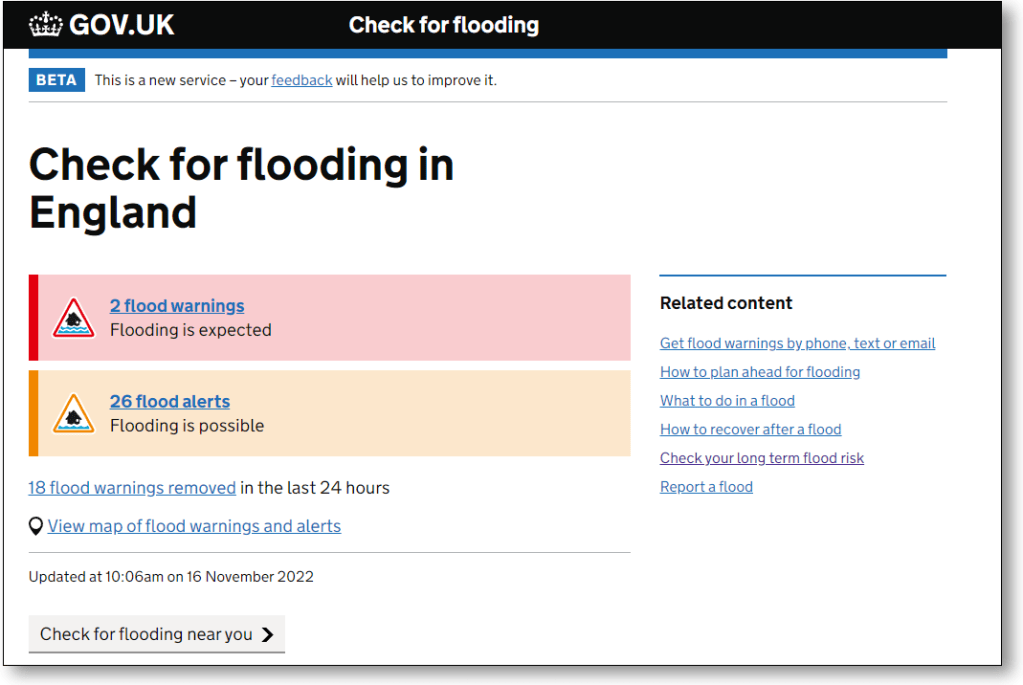
Real-time Flood Maps and Information
Another part of the GOV.UK website shows ‘real-time’ information and maps showing where flood warnings and alerts are currently in place and a link to allow you to find real-time levels and graphs of river, sea and groundwater levels. These are all related to Ordnance Datum and are most useful if you know some history of previous floods that may have affected your property. Click the image below to open the site, then follow the instructions on screen.
Coastal Change – Erosion
There are also a series of maps showing both Coastal Erosion and its management. A good place to start is at the UK ‘Check coastal erosion management in your area’ web page which you can open by clicking the image below. Pressing the green ‘Start Now’ button on that page will open the Environment Agency’s interactive mapping tool for coastal erosion. Zooming into that map, you will find detailed stretches of coastline. Clicking on any of those stretches will bring up a scrollable inset window containing further details.
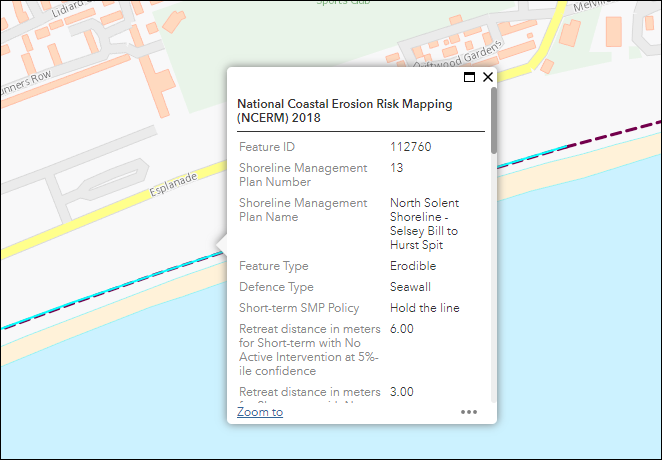
Note that in the further detail inset windows, you’ll find reference to the relevant Shoreline Management Plans (SMPs). Click that link to locate the local SMPs.
How to use all this information – Long Term Flood Risk Maps
A good place to start is the GOV.UK website page for ‘Check the long term flood risk for an area in England‘, where you can put in a postcode and select a ‘Flood risk’ attribute. Note that the site asks for an address but does point out that it will only show the area at risk and is not specific to the property. This is partly because there is no data in the system about either floor levels of each property, or any ‘property level’ defences, for example, type of flooring.
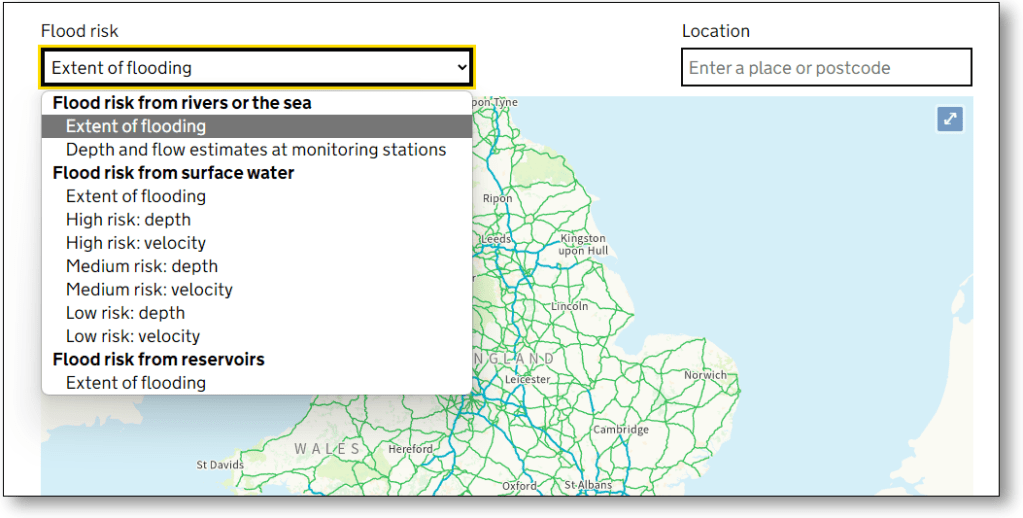
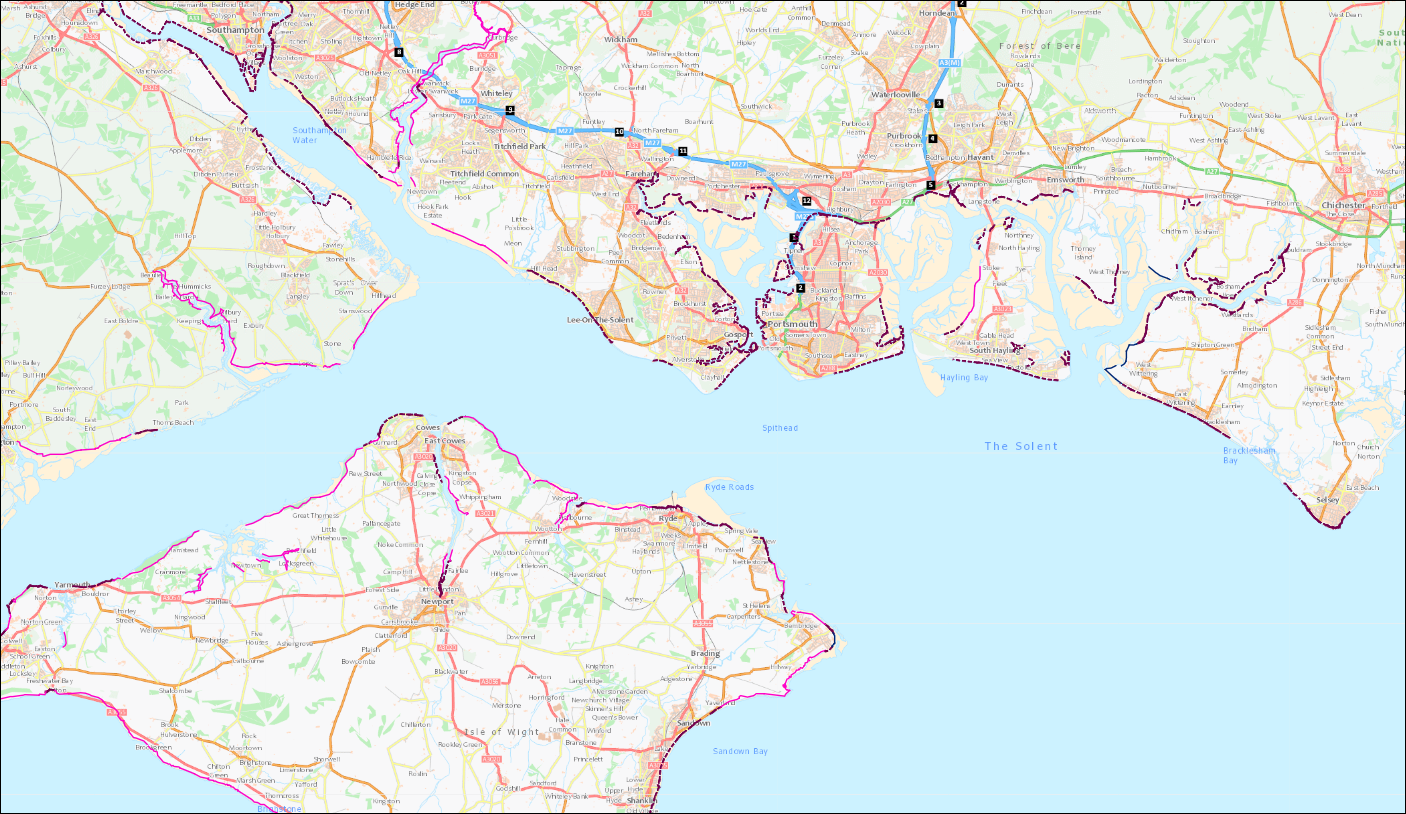
Under flood risk you get several options, each of which you can take a look at but just one of which, ‘Extent of flooding’, we discuss in detail here
- High – Chance of flooding greater that 3.3% in any one year
- Medium – Chance of flooding between 1% and 3.3% in any one year
- Low – Chance of flooding between 0.1% and 1% in any one year
- Very Low – Chance of flooding less than 0.1% in any one year
In all cases the classification considers existing sea-defences and to some extent sea-level rise.
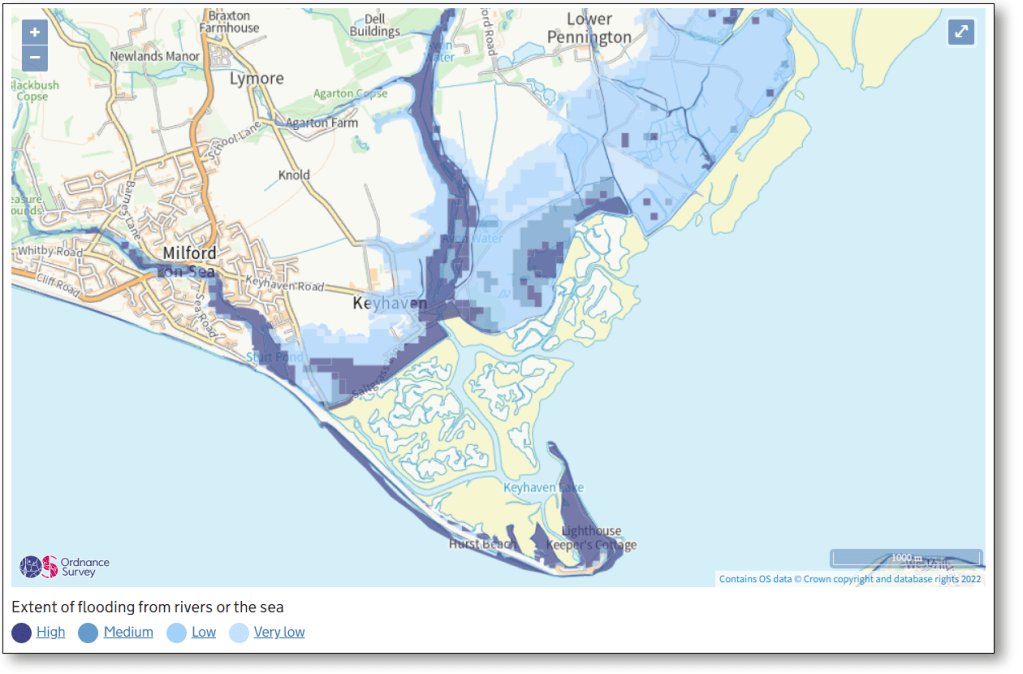
The example above shows the long-term flood risk, colour-coded for High, Medium, Low and very low risk. We have shown Keyhaven for these examples because the area includes samples of all the risks. Note that Pennington Marsh, in the top right of the picture, is shown in light blue – low risk.
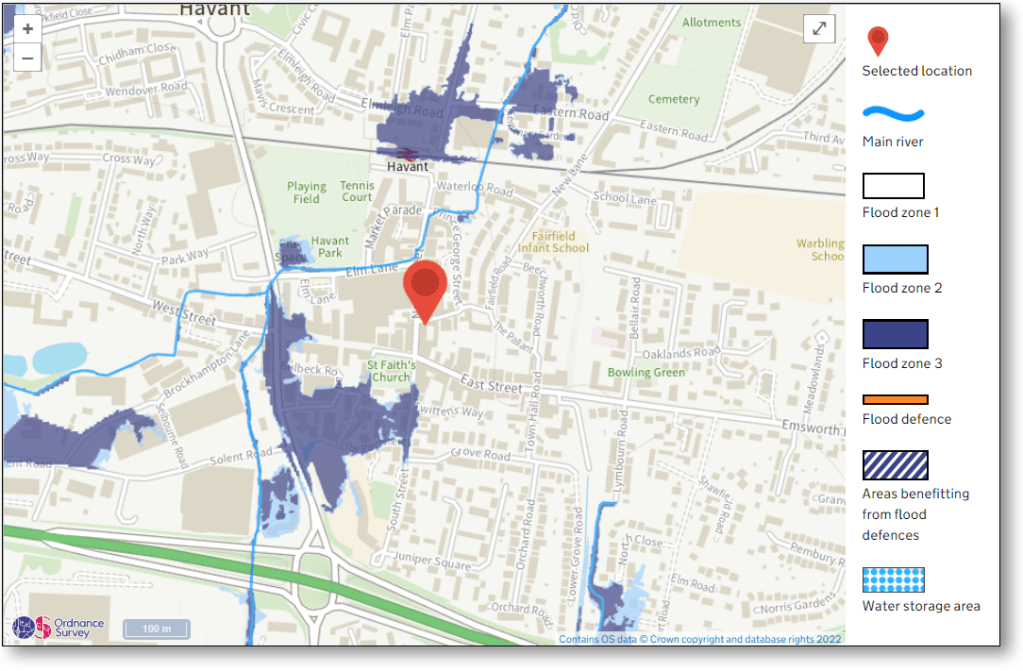
In contrast, the ‘Flood risk for planning’ map described earlier and shown below for the same area, depicts the Keyhaven area as ‘Flood Zone 3’ and an ‘area benefiting from Flood Defences’. It also shows in yellow the defences that provide this protection.
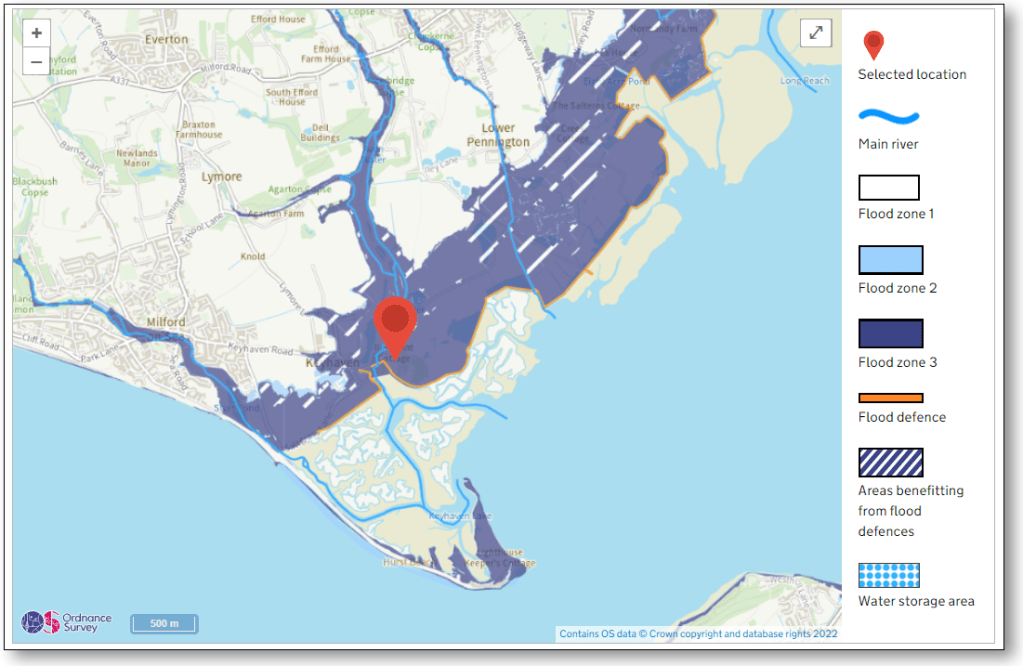
The definitions of the Flood Zones are as follows:
- Flood Zone 1 – Less than 0.1% chance of flooding in any year. Land having a less than 1 in 1,000 annual probabilities of river or sea flooding.
- Flood Zone 2 – Flood risk between 0.1% – 1% chance of flooding from rivers in any year or between 0.1% – 0.5% chance of flooding from the sea in any year.
- Flood Zone 3 – Flood Risk of 1% or greater probability of flooding from rivers or 0.5% or greater probability of flooding from the sea. (Flood Zone 3 is subdivided between 3a and 3b for planning purposes)
What does it all mean, and what should I do?
If you live by the sea, or close to a river, you are probably aware whether you are at risk, but in our experience the people who suffer most in a flood, are those who are unaware that they are at risk, and hence are surprised when a flood happens as they have made no preparation. So, it is worthwhile looking at some of the maps above to find out if you are at risk, and if so what type of risk. Also don’t just concentrate on your own property, it is also useful to know whether neighbours, roads and local businesses are in risk areas.
If you do discover that you are at risk, it is worth considering whether the Flood Warning Service would be useful. This uses various “channels” – phone, text, email etc to let you know about alerts and warning in your area.
By looking at the two maps above for your own address, you should be able to find not just whether you are at risk, but also whether you benefit from flood defences. This is useful to know, as although they often provide a high level of protection, there is still a risk, and should they be overtopped, or fail in some way, flooding behind can be quick and severe.
Most people have at least in mind a ‘fire plan’ – how they would get their family out of the house in the event of fire, but many who live in flood risk areas don’t have a flood plan. To do so you need to understand the type of risk. If you live in gently rising ground, you may well see water levels rising and have time to react, but if you live behind a sea-wall that you cannot see, a failure could result in water levels rising quickly. Simple precautions, like keeping valuable records and pictures upstairs could reduce the trauma of a flood. There is plenty of advice available.
How is it changing?
There has been much in the media about “sea level rise”, but unfortunately there are other effects from climate change that are probably more important. For instance
- Increased Storminess – The fact that climate change causes increased variability in our weather is almost universally accepted, so unfortunately, we are more likely to see larger storm surges and gales, which will bring larger waves.
- Increased rainfall – Water levels in estuaries are determined by a complex interaction between river flows and tides, and increased river flows (from heavy rain) will increase the chance of high water levels in estuaries.
- Higher low-tides – The drainage systems of all coastal towns rely on surface water being discharged at low tide. A not very well understood effect of climate change will mean higher low-tides and these drainage system function less well and increase the risk of surface water flooding.
In conclusion
Sea-level rise is clearly occurring and in the Solent area has been ongoing for thousands of years. Climate change will undoubtedly increase the rate of sea level rise and slowly increase the risk. However, there are actually few areas that will become ‘at risk’ where no immediate risk is currently identified.
It is best to understand your current risks, and plan to minimise the impact, should they occur, rather than worry about the numerical change in risk which is very hard to quantify. In contrast a local authority, or government agency, (and public utility whether private or publicly owned) needs not only to understand the risk but to also have policies and practices in place that reduce the risk for future generations.
(The author of this content is Tim Kermode MA CEng MICE CIWEM, coastal engineer and member of the SPS Council)
If you found this article of interest, please consider helping the Solent Protection Society, either through membership or by donation. We would welcome your support.
Please refer to the ‘Membership and Donations’ page.
Established 1956 Registered Charity 1154317
