
There have been many articles published recently predicting the future extent of tidal flooding and some show an horrific picture. It is important therefore to understand how these scenarios are derived. In simplistic terms we start with a “Digital Terrain Model” (DTM). This is the computer equivalent of a physical model of the land and every pixel is assigned a height. Then you take a “predicted” water level and you ask the computer to colour in everything below that level, which is very similar to taking a traditional Ordnance Survey map and colouring everything below the 5-metre contour.
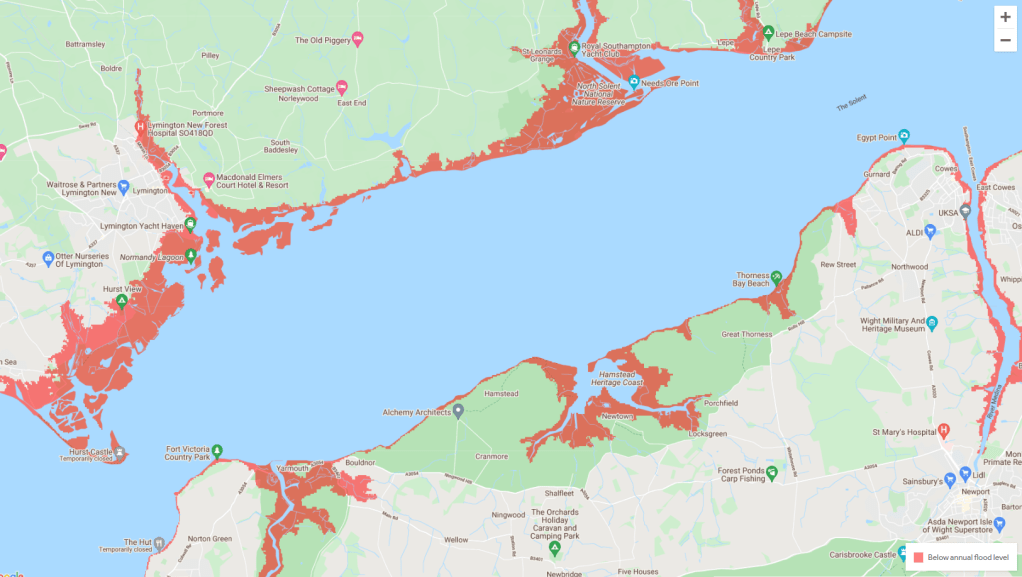
As you will see there are assumptions that need to be understood to decide how useful the map is. Firstly, let’s look at “water level” predictions.
Water level predictions
As we all know the water level around the coast is tidal, with high tides occurring twice daily, spring and neap tides on the Lunar Cycle and bigger springs at the equinox. There are other complicated factors that result in small variations over a longer cycle of 18.6 years. These tidal levels are shown in tide tables and can be predicted many years in advance. As they vary locally, tables are predicted for the nearest major port. However, if you read the tide table carefully you will find notes to the effect that tides are calculated under “average weather conditions” so, “tide table” tides take no account of unusual weather conditions.
If the atmospheric pressure is high, sea level is slightly depressed and vice-versa. However, there is a more pronounced effect when the low-pressure system moves at about the same rate as the natural tidal movement, producing what is known as a tidal surge or storm surge. In the case of the Solent, if a depression follows the English Channel it can result in the observed tide being up to about a metre above the tide-table tide.
The same low-pressure systems also generate strong winds; hence large waves, and the combined effect of storm surges and large waves can lead to flooding if there are not adequate defences. Surge predictions are produced continuously by the “National Tidal and Sea Level Facility” (https://www.ntslf.org/) and used, in combination with wave forecasting, by the Meteorological Office and the Environment Agency to generate Coastal Flood warnings.
Sea Level Rise
There is much talk about sea-level rise, but sometimes with little clarity about what it means in practice. There are two distinct mechanisms that produce a rise in local sea-level, geological (Isostatic) and climatic (Eustatic).
Following the last Ice-age, which covered the North of England and Scotland, the northwest of Britain is rising and the southeast sinking, tipping about a line roughly from Cornwall to the Wash. This is why ordnance datum (ODN) is based at Newlyn in Cornwall, which shows no change. Before 1921 Ordnance Datum Liverpool was used and since Liverpool is rising there are variations between the two. In the Solent area the land is sinking by about 1mm a year, and this is fairly constant.
The Eustatic sea level rise has two major components, thermal expansion and melting of ice on land. As the sea temperature increases it expands and so the total volume of seawater in the world increases causing a general rise. As ice on land melts and drains into the sea it also causes an increase in the total volume of water in the oceans and consequently sea level rise. Melting of floating ice does not directly increase sea-level, but unfortunately it does have another effect. As seawater is much darker that ice, it absorbs more of the sun’s radiation and so creates a general rise in the temperature of the oceans.
Rates of Sea Level Rise
There are lots of different estimates of sea-level rise, both historically and for the future, but future predictions are only
estimates and depend on assumptions made, particularly on Greenhouse Gas emissions. Historically, in the Solent there has been a consistent sea-level rise since the last ice-age of about 2mm per year, but there is strong evidence that this has now increased and is currently between 3mm and 4mm per year. In August 2021 the Intergovernmental Panel on Climate Change (IPCC) issued a major report on all aspects of Climate Change. Chapter 9, entitled “Ocean, cryosphere, and sea level change”, concludes that global sea-level rose faster in the 20th century than over the previous three millennia. IPCC estimate that global sea-level increased at a rate of 2.3mm per year at the start of the 20th century but further increased to 3.7mm per year from 1971 to 2018. These are global figures and local factors need to be added. IPCC conclude that by 2050 global sea level is likely to rise by about 200mm (6mm per year) increasing to 600mm (8.5mm per year) by 2100. The further ahead we look, the more uncertainty, as some factors are now impossible to mitigate. We
need to plan for these future increased sea levels.
We should also plan for flexibility as, with increased understanding, it is certain that the estimates will need to
be revised. The Further effect of Sea Level Rise As described earlier, flooding in most of England is caused by a
combination of tidal and meteorological events, so sea-level rise does not simply cause flooding, but increases the frequency of flooding. There are other effects which, in the longer-term, are also potentially serious.
The natural consequence of rising sea levels would be for marshes and beaches to move inland, however, since Victorian times, most of our coastline has been “managed”. In effect we have a Victorian coastline with a 21st century foreshore. This generally makes it difficult for natural processes to continue with the result that both marshes and beaches will be lost in a process known as “Coastal Squeeze”. This in turn allows larger waves to reach any sea defences and so cause an increased probability of both flooding and coastal erosion.
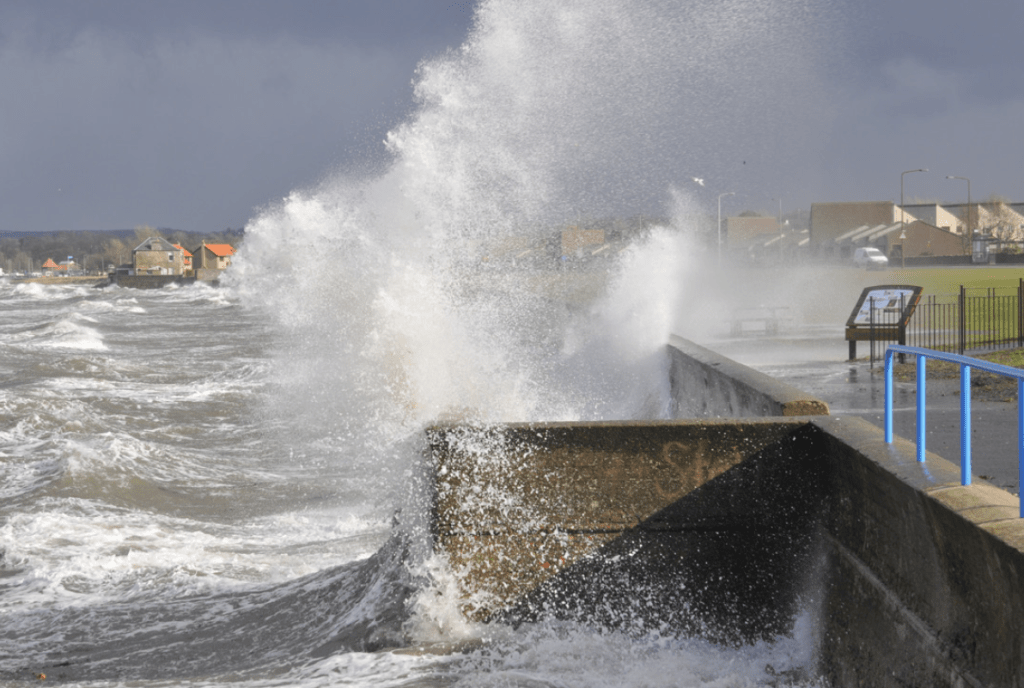
We have all seen the spray which results from a large wave hitting a near vertical seawall, but roughly the same amount of energy is also directed downwards and will erode the beach below. This will continue until the beach is below low-tide level. The same process happens with salt marsh, but in a low-energy environment (smaller waves) over a much longer timescale. The long-term effect, particularly if seawalls are retained in their current orientations, will be the loss of our beaches with all the economic consequences for coastal towns.
There is another effect that is often neglected. In all coastal towns the surface water from roads and sometimes rivers, is discharged to sea through sluices or tide-flaps. These allow water to drain out at low tide but stop the seawater coming back at high tide. Consequently, marshes have been drained and in some cases land “reclaimed” to only just above low neap tide level. The marshes at Bembridge are such an example. As the sea-level rises the period over which water can drain reduces and unless there are major changes in the surface and highway drainage systems, for example the installation of more storage or pumps, surface water flooding will occur more frequently. As almost all climate change scenarios predict increases in rainstorms, the combined effect will lead to more flooding, particularly in low-laying coastal towns. Sadly, this effect has not been widely recognised and it is likely that some serious incidents will occur before it is seen as a national priority.
Author – Tim Kermode, TK Coastal, Member of the SPS Council.
This article first appeared in the Solent Protection Society Members’ Newsletter, Autumn 2021.
For details of how to become a member of SPS and received these articles hot off the press, take this link and get in touch.
