
The short answer: the very dry summer of 2025 helped bring total spill hours across the Solent back down to their lowest level since 2020 – but a closer, site-by-site look shows that not every combined sewer overflow (CSO*) is actually improving. At our August Council meeting, SPS committee member Duncan Purdie presented an updated set of graphs comparing individual outfalls in 2022 and 2025, the two most recent years with similar rainfall, building on the five-year trend analysis we reported last October. The results are encouraging overall, but a handful of stubborn exceptions – several of them clustered around the same catchment – show there is still work for Southern Water to do.
Five years of rain, and five years of spills
SPS has now been tracking CSO spill data across the Solent for several years (see our earlier reports below), and the headline chart – shown again below, now extended to 2025 – remains the clearest single picture of the trend. The navy line tracks total spill hours across all Solent CSOs each year; the orange line tracks the smaller group of SPS worst case sites we monitor most closely; and the green line, on the right-hand axis, tracks average regional rainfall.
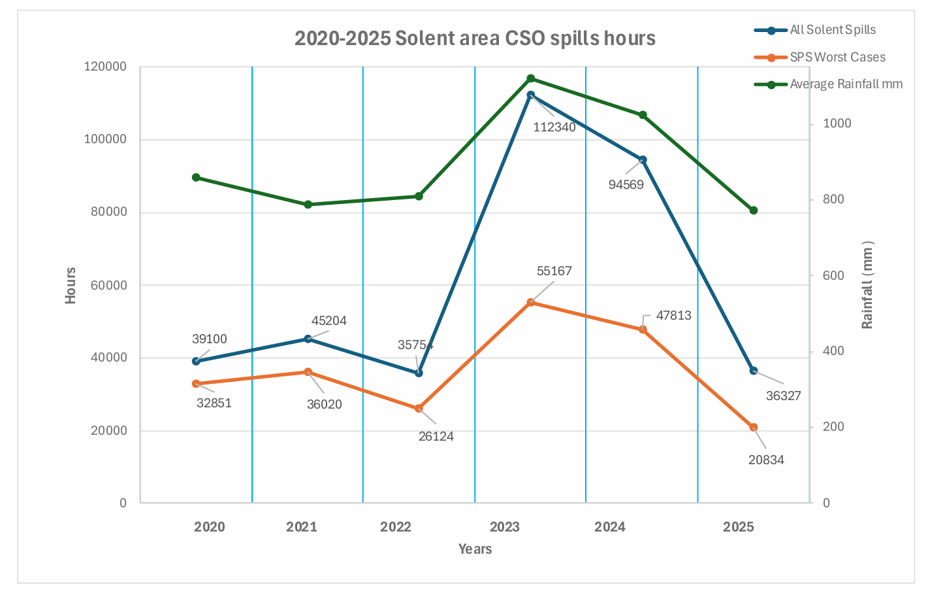
The pattern tracks rainfall closely, with total spill hours sharply increasing through the wet years of 2023 and 2024 – peaking at 112,340 hours in 2023, alongside the wettest rainfall of the six years shown – before falling back to 36,327 hours in 2025, close to the levels recorded in the similarly dry years 2020 (39,100 hours) and 2022 (35,754 hours). The SPS “worst case” subset shows the same pattern, and in 2025 actually fell below both of those earlier dry years, to 20,834 hours.
Because 2022 and 2025 had such similar rainfall, comparing outfall-by-outfall performance in those two specific years – rather than simply comparing headline totals – offers a fairer test of whether individual CSOs are genuinely getting better, isolated from the effect of a wetter or drier year. That comparison is the subject of the next two graphs.
So which mainland CSOs have actually improved?
The graph below splits out mainland CSO sites only, comparing 2022 (open circles) against 2025 (filled circles), ordered from left to right by how long each site spilled for in 2022.

At most – though not all – of the eighteen mainland sites shown, the 2025 figure sits below the 2022 figure, indicating a genuine reduction in spill duration under broadly similar rainfall. Chichester WWTW, the longest-running site in 2022 at around 1,200 hours, improved to roughly 985 hours in 2025. However five sites bucked this trend and showed increases in spill duration in 2025 compared to 2022.
- Pennington WWTW – substantially worse in 2025 than 2022.
- Hambledon PS – slightly higher in 2025 compared to 2022
- Lyndhurst WWTW – higher in 2025 than 2022.
- Boldre (Water West) WWTW – also higher in 2025.
- Flexford Lane, Sway WWTW – higher in 2025.
Several of these sit within, or feed, the same Lyndhurst/Lymington river catchment – a detail our previous committee member Mike Rainey had flagged as worth sharing with the Southern Water local catchment contact, Keith Herbert, for comment. That follow-up remains outstanding and SPS intends to pursue it.
And on the Isle of Wight?
The third graph below repeats the same comparison for the fourteen Isle of Wight CSO sites that SPS tracks, again ordered by 2022 maximum duration.
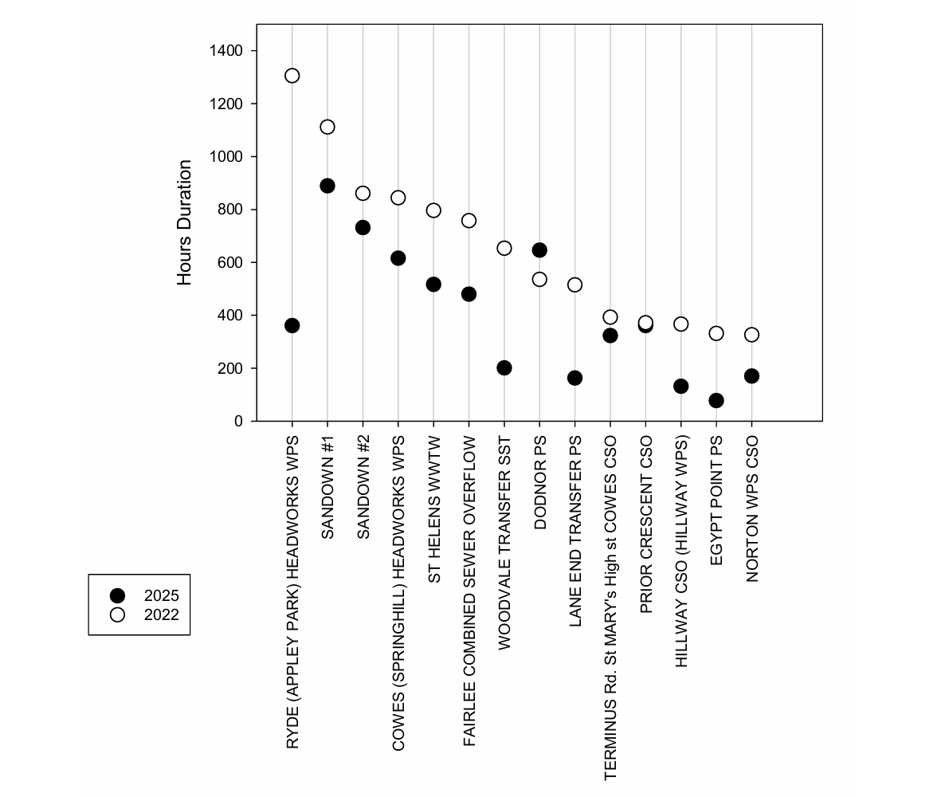
The picture here is, if anything, more consistently positive than on the mainland. Ryde (Appley Park) Headworks WPS, by far the longest-running Island site in 2022 at around 1,300 hours, fell to roughly 360 hours in 2025. Almost every other Island site shows the same improvement, with one clear exception: Dodnor Pumping Station, discharging into the River Medina roughly midway between Newport and Cowes, where the 2025 figure exceeded 2022. Prior Crescent CSO – was essentially unchanged in total spill hours between the two years.
Taken together, around five of the eighteen mainland sites failed to improve between 2022 and 2025, against only one exception on the Isle of Wight – suggesting that, on this measure at least, Southern Water’s recent investment has apparently been more consistently effective on the Island than on parts of the mainland.
Reading between the lines
Two useful cautions came out of the Council’s recent discussion of these graphs, and are worth sharing alongside the data itself.
Population is not the whole story. It might be assumed that spill totals simply track population – more people, more sewage, more spills. But the New Forest/Lyndhurst area, which has a comparatively small population, features prominently among the worst-performing mainland sites, while some far larger catchments perform better. That points to how a particular works is run and maintained mattering at least as much as how many people it serves.
“Similar rainfall” is not the same as “similar rain.” Comparing 2022 and 2025 works because the two years had similar total annual rainfall – but CSO spills are triggered by short, intense bursts of rain, not by the year’s cumulative total. Several of the underperforming mainland sites sit at the head of short, fast-responding (“flashy”) streams around Lyndhurst, which react strongly to intense rainfall regardless of the annual total. Two years with the same total rainfall can still have very different spill outcomes if that rain fell in different patterns. This is a genuine limitation of year-on-year comparisons, and one SPS will keep in mind as we refine this analysis.
This last point connects to a broader theme in our reporting: dry-weather spills matter disproportionately. Spills that occur during genuinely dry periods – as opposed to storm overflows during heavy rain, which the system is explicitly designed to permit in limited circumstances point to an underlying failure in the plant or network itself, not simply to the weather. SPS holds detailed spill-by-spill data (courtesy of Clean Rivers and our own committee members’ analysis) that can help distinguish the two, and we intend to make more active use of it in future reporting.
SPS will follow up on sharing the Lymington-catchment findings with Southern Water and will continue to track both the region-wide trend and the individual “worst case” sites identified here as 2026 data becomes available.
Richard Brown
Duncan Purdie
Mike Rainey
Further reading
CSO sewage discharges into the Solent (October 2025)
Untreated sewage continues to spill into the Solent (June 2023)
Pollution in its many forms (September 2020)
*CSO = Combined Sewer Overflow; WWTW = Wastewater Treatment Works; PS = Pumping Station.
SPS is a small, entirely voluntary society, and analysis like this – digging into the detail behind the headline sewage-spill figures – depends on our members and supporters. If you would like to help us keep doing it, please consider joining SPS or making a donation via the Membership and Donations pages of this website.
