How did Solent area Combined Sewer Overflows (CSOs) do in 2024?
The short answer is better than the dreadful year of 2023, but most of this reduction was significantly due to less rainfall in 2024.
So, some slight improvement but still way above 2022 and very significantly above the government’s target.
Background
The Solent Protection Society (SPS) started looking into pollution sources into the Solent in 2019 with the publication of this post. For the 5 years since, we have analysed the Environment Agency (EA) annual data for Combined Sewer Overflows (CSOs) into the Solent and published the results.
In the early days Southern Water (SW) were reluctant to even tell us where their overflow pipes were located. Gradually information came to light through pressure from organisations like Solent Protection Society, Surfers against Sewage, the Rivers Trust, many individuals, the press and finally Members of Parliament which resulted in Southern Water introducing their interactive map called ‘Beachbuoy’ in 2021 in an accessible format. This marked a significant breakthrough in providing near real-time data, though its scope was limited to bathing beaches already subject to nominal legislative safeguards. It wasn’t until further government legislation in 2024 that comprehensive mapping began, revealing the locations of all CSO outfalls nationwide.
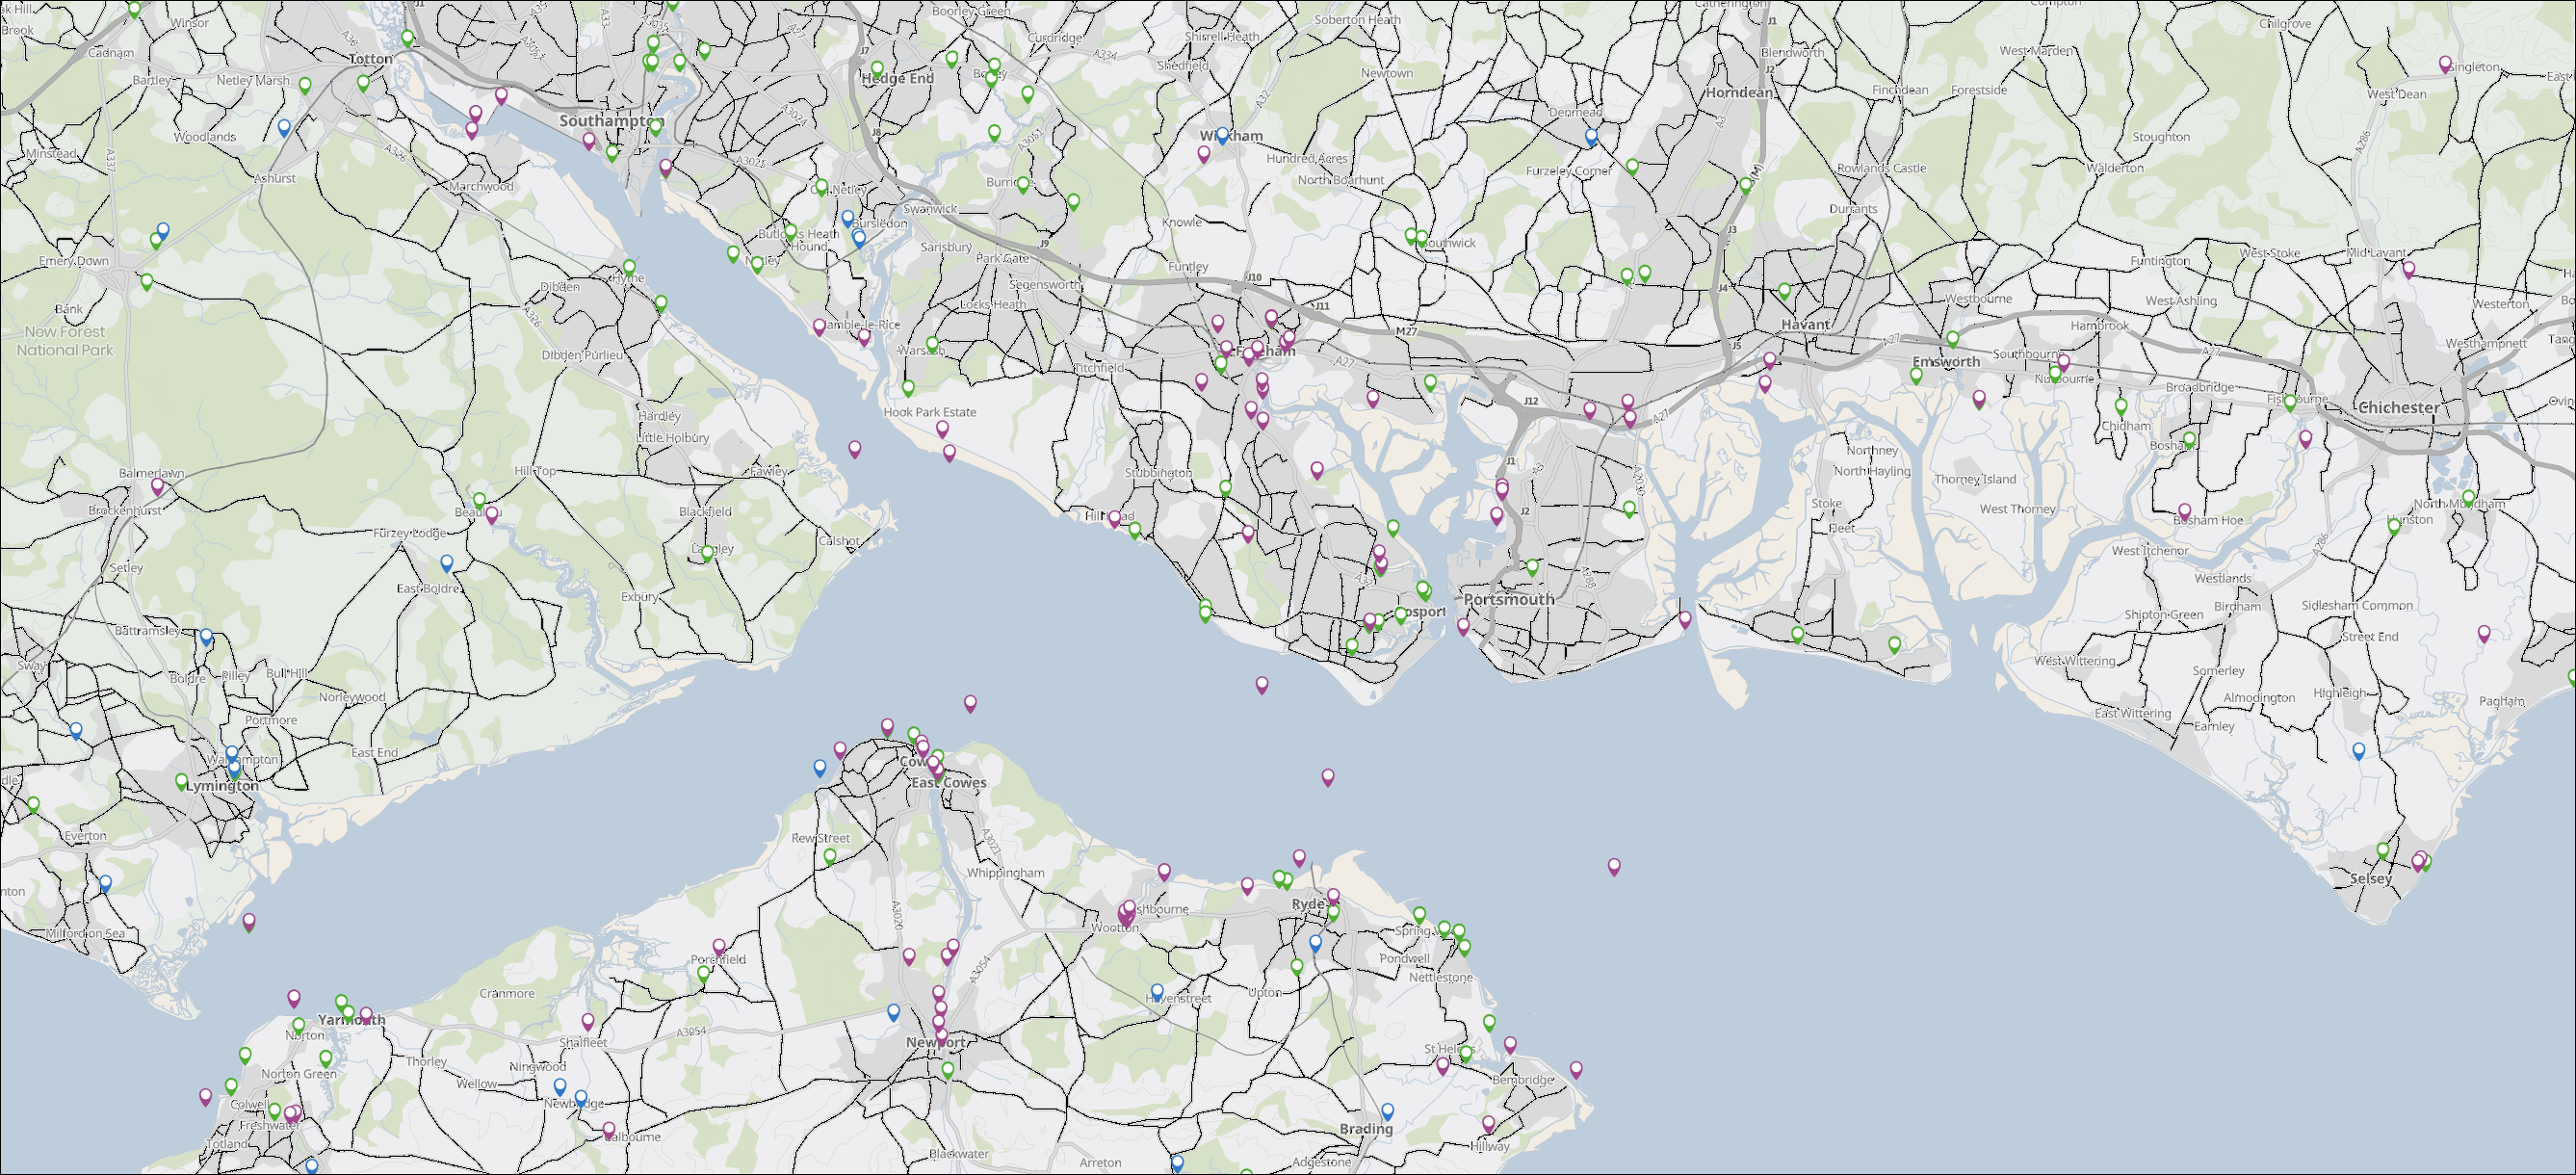
Back in 2019, our analysis of Environment Agency data revealed that between 260 and 300 Combined Sewer Overflows (CSOs) were discharging into the Solent. Determining an exact number proved difficult, as Southern Water’s naming conventions for some outfalls changed across successive data releases, and technical adjustments added further complexity. What matters now is that the scale is significant and we can now map their locations.
Far from being ‘real time’, the Environment Agency data is published annually in arrears in the July of the following year so it was not until 2021 that we could analyse the data for 2020. It quickly became clear that not all CSOs were equal – some were responsible for far more significant discharges than others. SPS identified a group of around 38 outfalls as the worst offenders. Though they made up only around 15% of the CSOs discharging into the Solent, they were responsible for roughly 75% of the total spill time in the early years – a measure now referred to as Hours Duration.
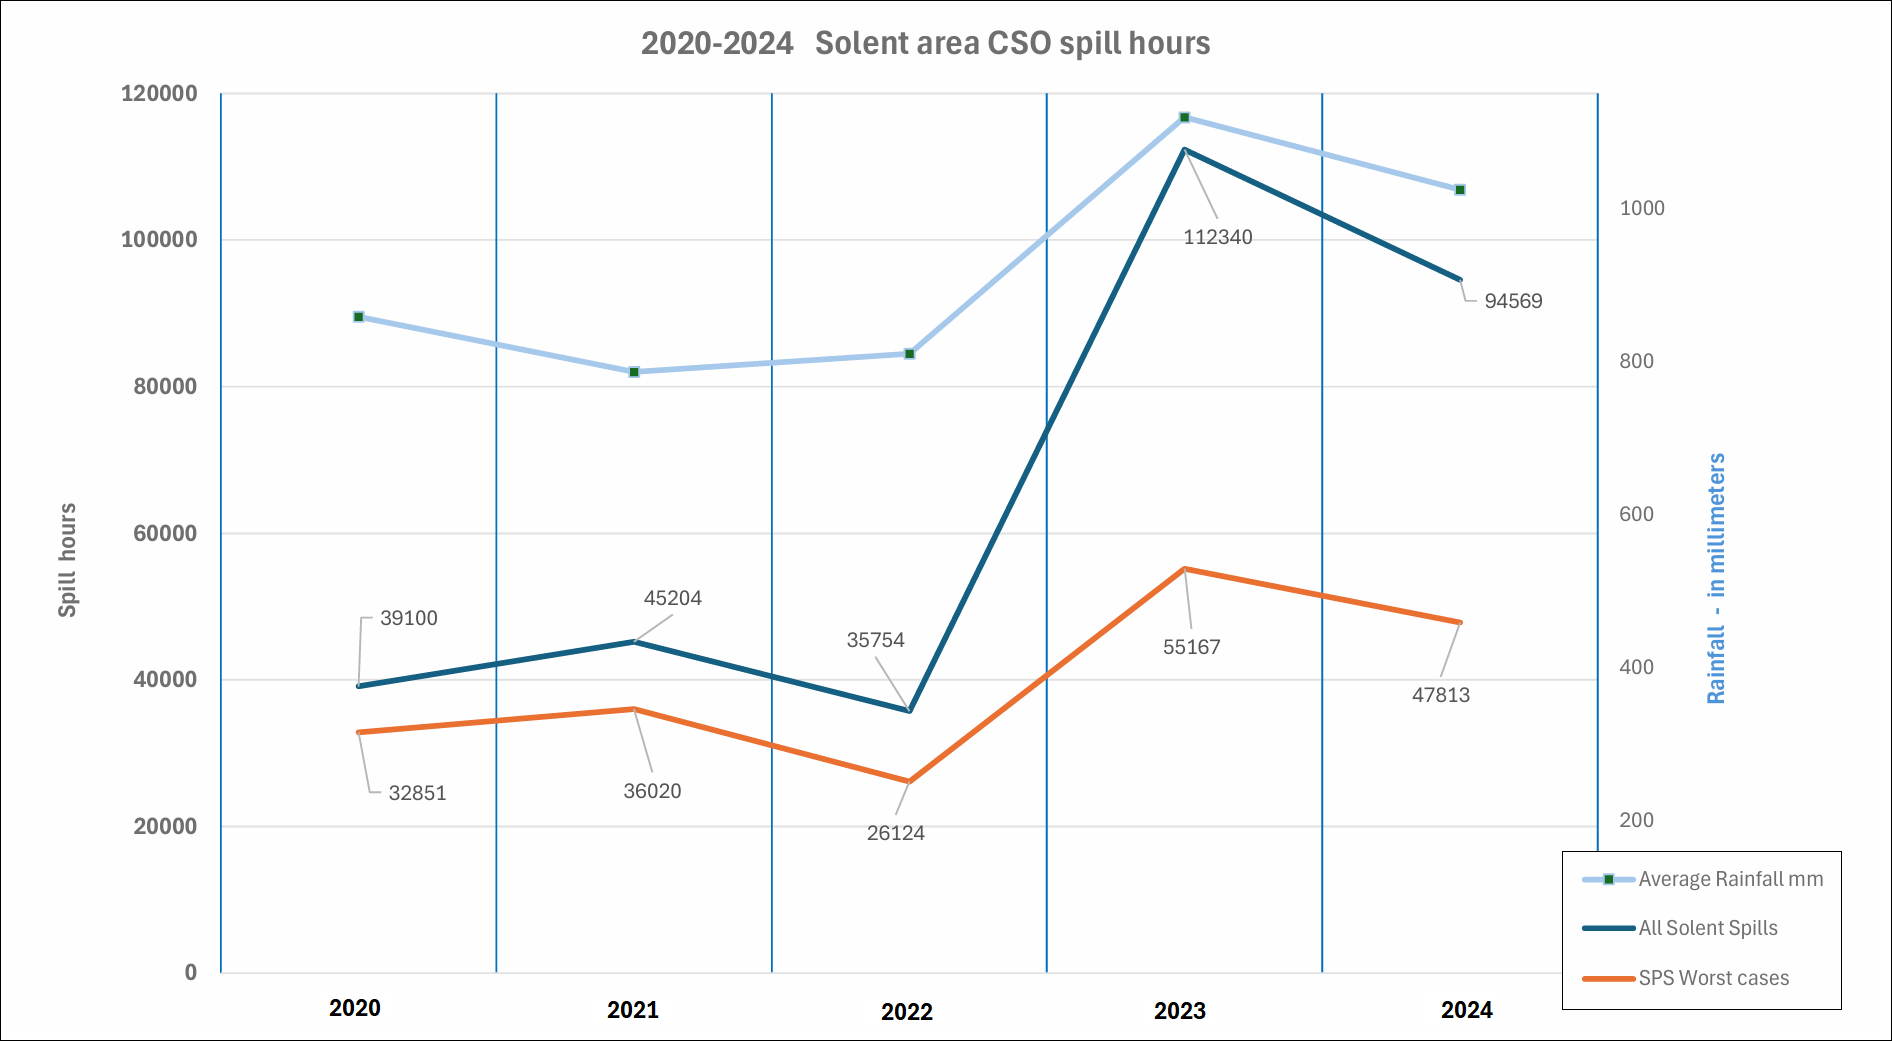
So what does the tracking of the five year trend show? – Graph 1
The data and graphs below show the pattern that has emerged.
The introduction of Beachbuoy enabled real-time observation, revealing that sewage spills almost invariably occurred following rainfall. The Environment Agency later confirmed that the national decline in spill incidents during 2022 was primarily attributable to lower rainfall levels that year. Although the Solent also experienced a reduction in spill hours, its average rainfall remained comparable to 2021, indicating no straightforward correlation. Other contributory factors appear to be influencing outcomes at the margins.
Although we knew 2023 would be wetter, the dramatic surge in spill hours still caught us off guard. We had considered 2022 a poor year, yet by 2023 the situation had deteriorated significantly. The imperative to divert rainwater from combined sewer systems was becoming increasingly urgent – a reality almost certainly recognised by the Water Companies, but only slowly coming to public attention.
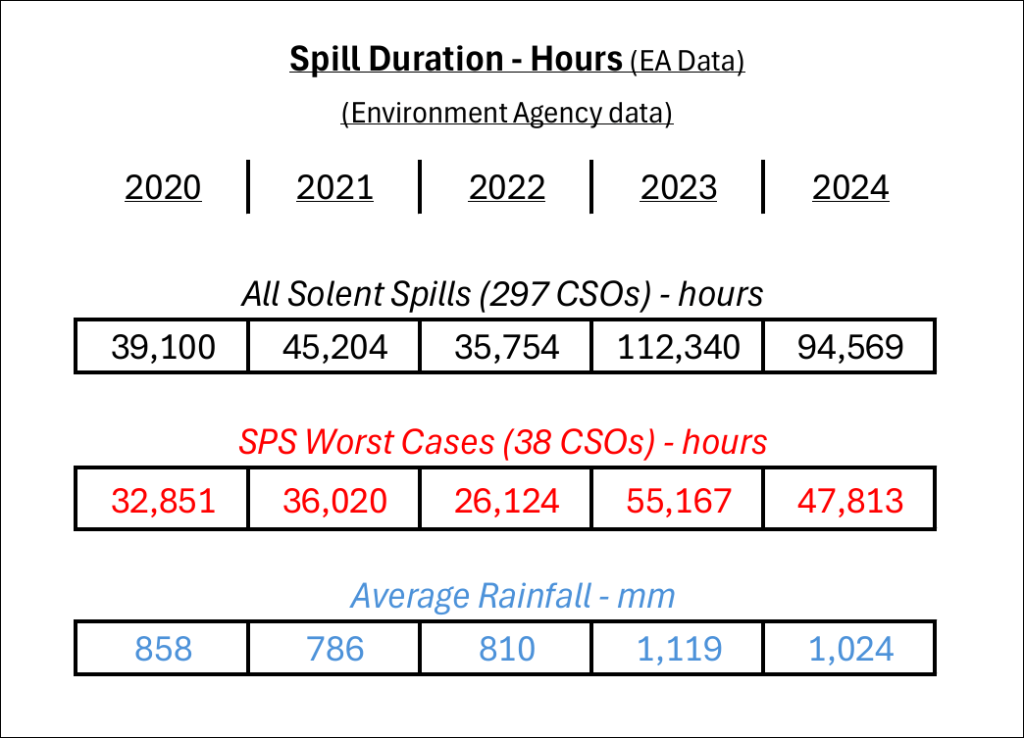
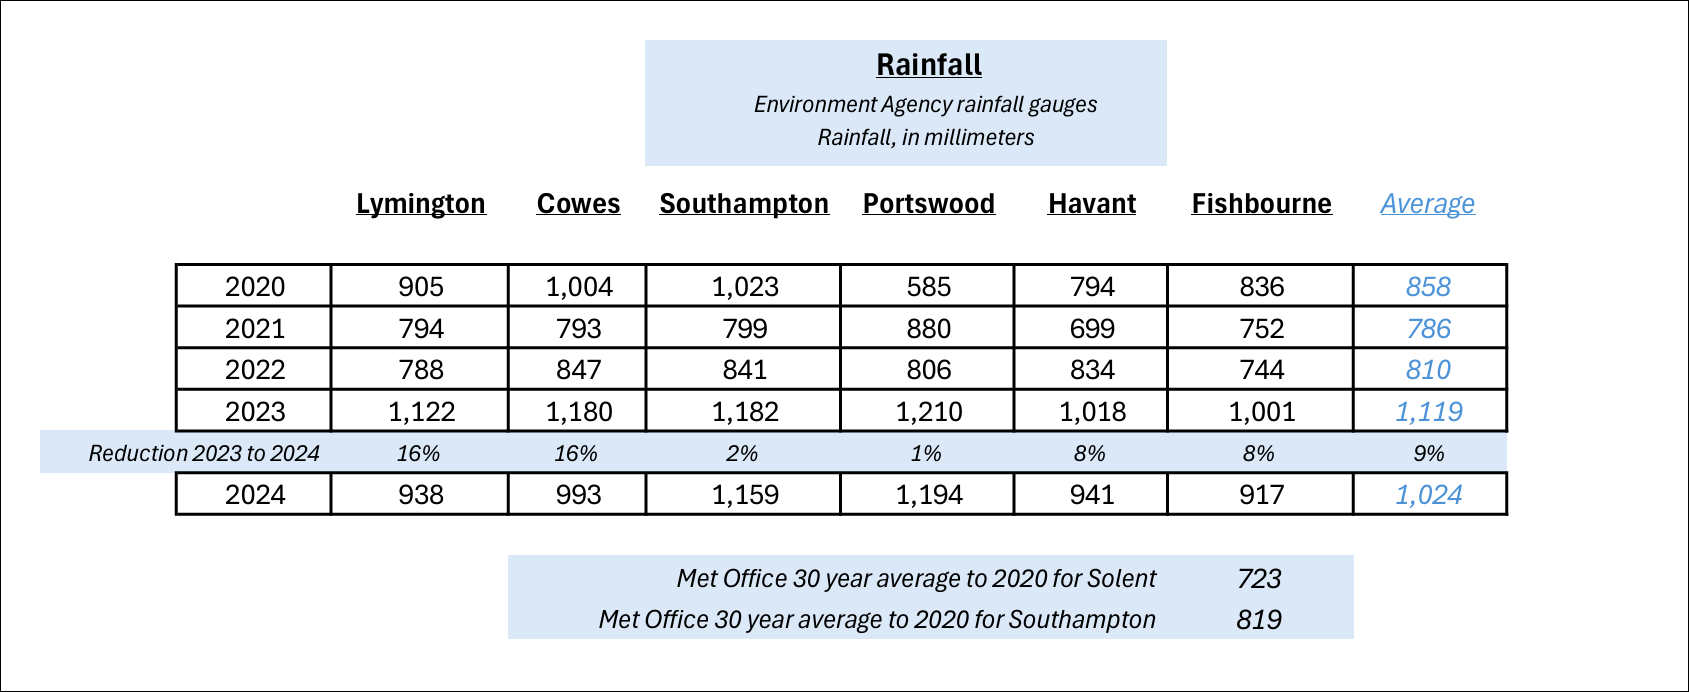
For 2024, we focused on the 38 worst-performing sites and assessed rainfall patterns across the Solent region. The second table illustrates the reduction in spill hours compared to 2023, alongside the average decrease in rainfall between 2023 and 2024 – though this varies by locality. It also highlights how rainfall levels in both 2023 and 2024 exceeded those of 2022, which was broadly average. Notably, rainfall in 2023 surged by nearly 40% relative to 2022.
Graph 1 and the detail data, below, shows the duration hours broadly following the annual average Solent rainfall. It is not, as already stated, a direct correlation but rainfall clearly has a significant impact.
The 38 SPS ‘Worst Case’ CSOs – Graph 2
For 2024 we have tabulated each CSO by name and Hours of Spill (Hours Duration). They have been ranked from highest to lowest. The first thing to state is that two extremely high CSOs have been left out of Graph 2.
Kings Somborne, that feed into the Test then Southampton Water and Lavant, which feeds into Chichester Harbour. They are included in Graph 1 so we compare like with like. Kings Somborne is affected by ground water infiltration that becomes extreme in years of high rainfall and Lavant now feeds into a wetland treatment area, but the outfall is still recorded as untreated. Kings Somborne clearly needs a lot of pipelining much of which may be on private sewers over which Southern Water have no legal right to change but it illustrates one of the problems of getting rainwater out of the combined system.
Graph 2, below, therefore shows the results for 36 worst cases.
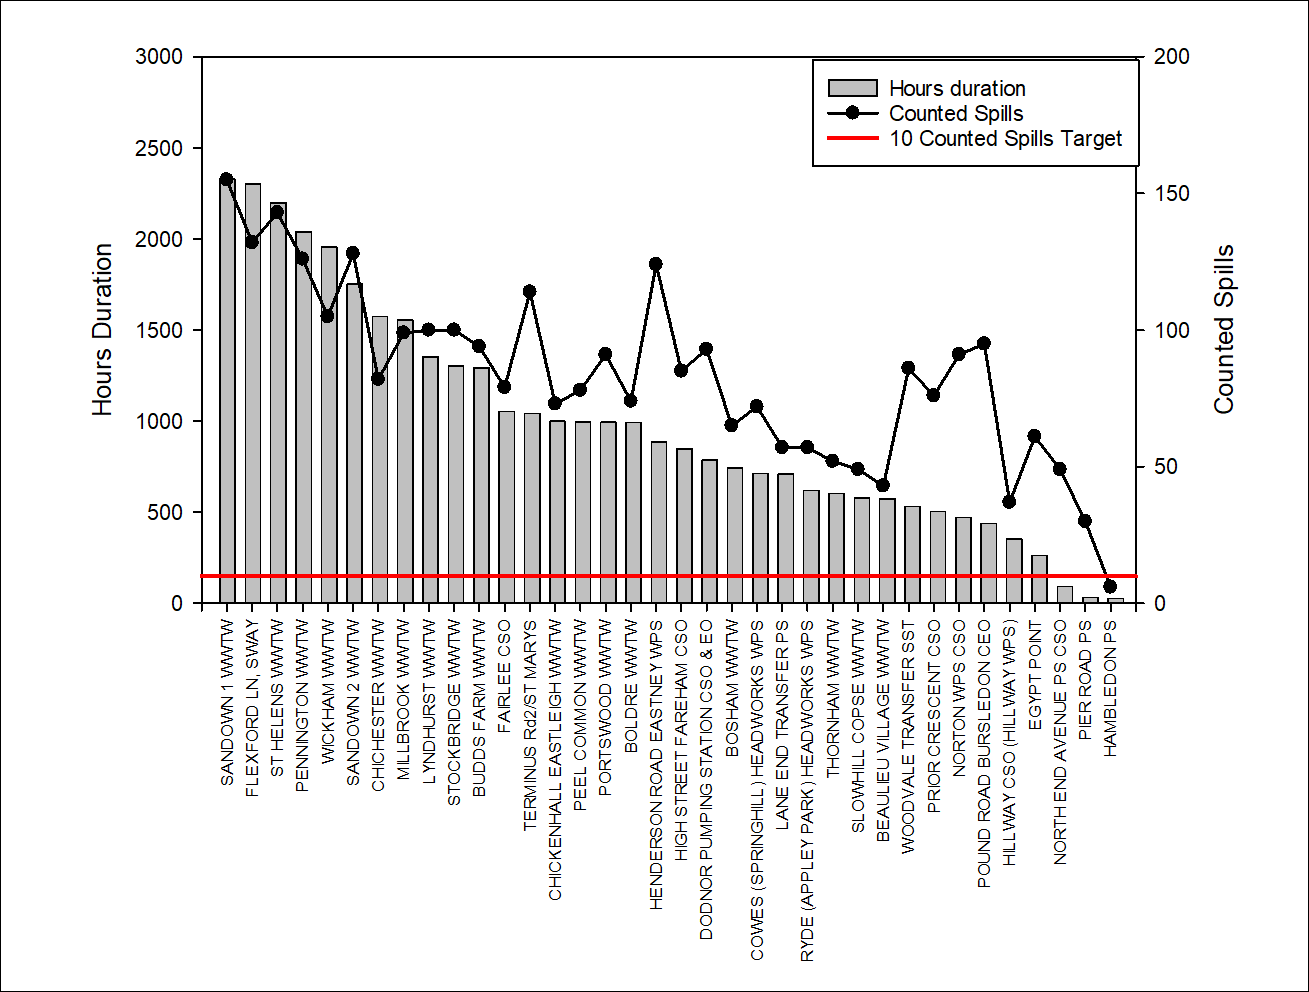
There is a second component to Graph 2 which shows the ‘Counted Spills’. This is the Government’s new preferred method of judging the success or otherwise of the water companies’ efforts to reduce CSO spills. It is shown as a line graph over each of the 36 CSOs under review.
The count uses the 12/24 method which is not the same as just counting each spill however long it lasts. Essentially all spills in the first 12 hours count as one spill. Then all spills in the next 24 hours count as one spill and so on until there are no spills for a further 24 hours. For a detailed description of the 12/24 method take this link to the Ofwat website.
The government’s target is no more than 10 counted spills per annum per CSO. This is illustrated by a red line at the bottom of the graph. In all cases, other than Hambledon Pumping Station, they are above the Red Line.
Those with higher Hours Duration of spills have, as would be expected, higher counted spills but there is no direct relationship between the two. So, as the Hours Duration reduces there are often significantly higher Counted Spills. This is likely to mean that the system is working near capacity with more frequent shorter spills to keep flows within pump capacity. However, the water company will be penalized for the higher number of Counted Spills. SPS prefers the Hours Duration measure and will continue to analyse both.
Hambledon is another CSO subject to groundwater infiltration, but SW have caried out significant pipe sealing and this appears to have been effective with low Hours Duration and low Counted Spills.
So what about the different locations around the Solent?
36 Worst case CSOs by Location in 2024 – Graph 3
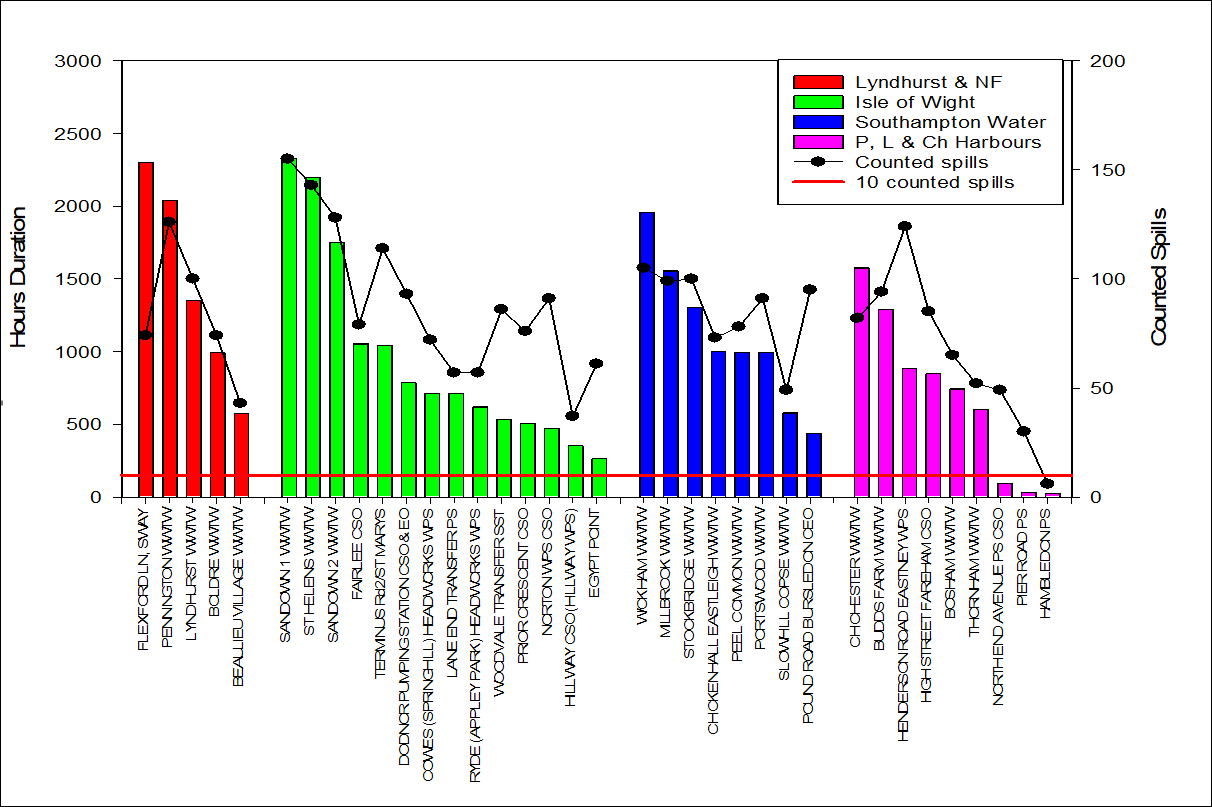
In previous years we have looked at CSO spills in relation to their position in the Solent and its tidal rivers and harbours. For the 2024 analysis we have looked at the main catchment areas for the principal waste water treatment works. For example, all of the Isle of Wight Solent CSOs are treated at Sandown WWTW. The result is four broad locations – Lymington and the New Forest (5 CSOs), Isle of Wight (14 CSOs), Southampton Water (8 CSOs), The Harbours of Portsmouth, Langstone and Chichester ( 9 CSOs).
These are shown in Graph 3 for both Hours Duration and Counted Spills.
As expected, the Isle of Wight accounts for about 40% of the worst CSOs for a relatively small population compared to South Hampshire. It also shows the greatest variation between Hours Duration and Counted Spills. Perhaps this is due to the work by Southern Water on its Pathfinder project over the last two years or perhaps the topography plays a part.
So how do all these figures add up?
Solent Location Totals Graph 4.
Graph 4 illustrates the total Hours Duration of 35500 hrs in total for the 36 worst cases by the totals for each of the four Solent Locations. It also records the total Counted Spill hours for each location. It also shows the average Counted Spills for each location. These range from 89 to 65 spills per CSO in 2024 with an average some 8 times higher than the Government target of 10 Counted Spills per annum.
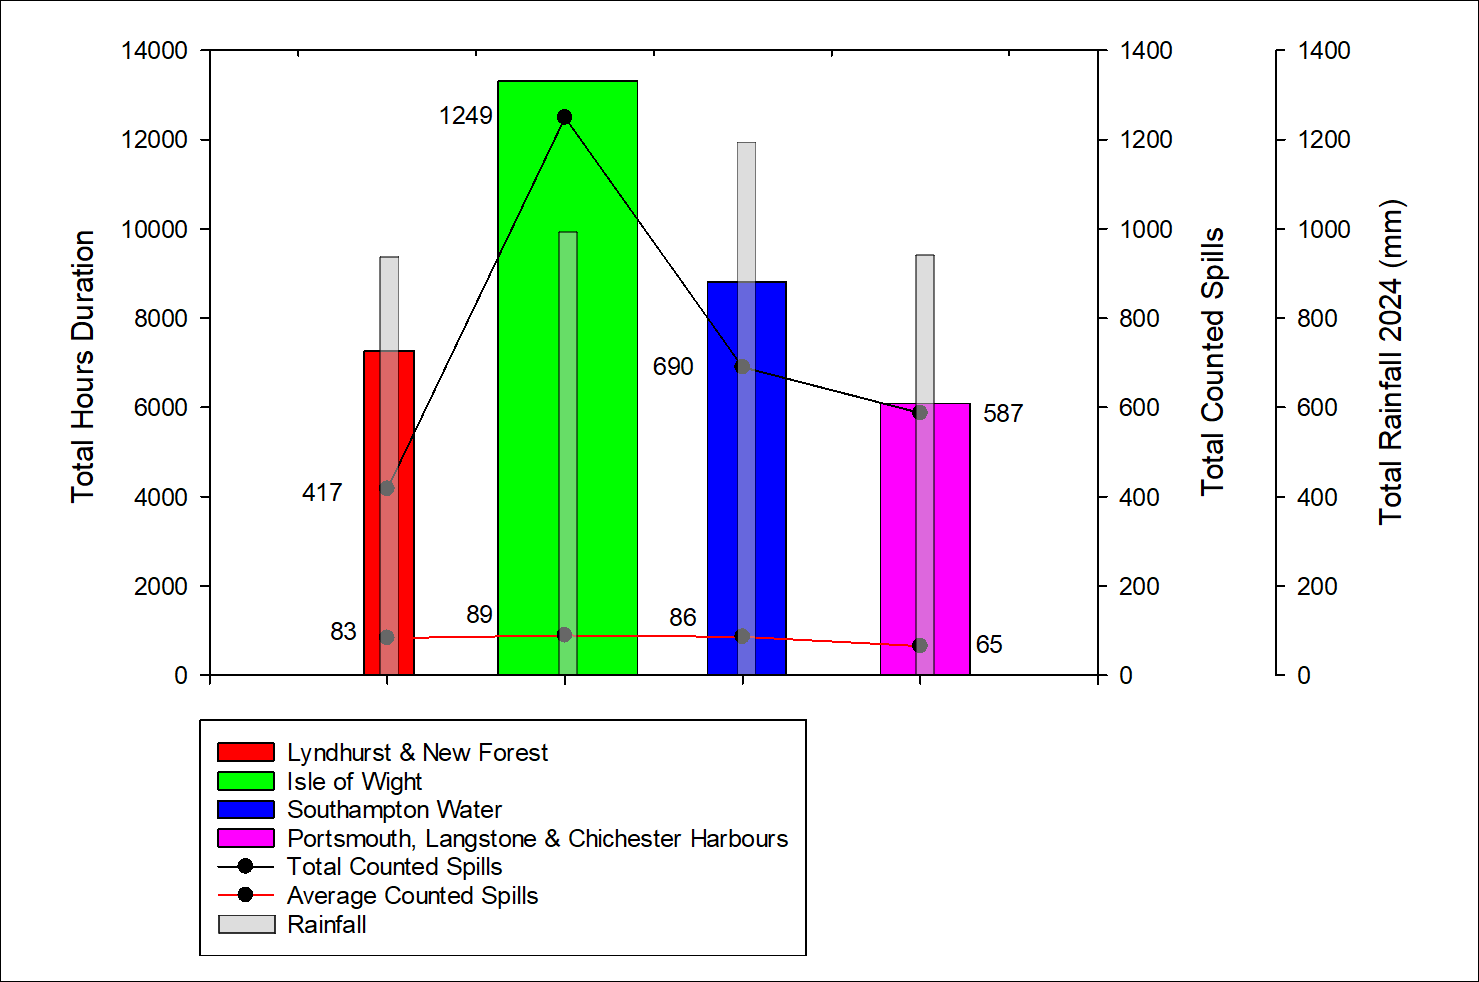
Finally, the average annual rainfall in 2024 for each location is shown which illustrates how it varies from one location to another. While there is not a direct correlation it highlights that the Isle of Wight has more (worst case) spills than rainfall compared to other locations. The Isle of Wight network is clearly working near capacity and reacts quickly to rainfall which is borne out by observation.
So, What to conclude?
We know Southern Water are now focusing, thank goodness, on trying to reduce storm overflows of untreated sewage through the numerous combined sewers that feed into the Solent, but these figures show just how big a task it is.
While our 36 Worst cases have a high average spill rate of 80+ the average for all the 261 CSOs we have monitored into the Solent is around 31. Still 3 times the government target of 10, but as we have shown such averages disguise some really bad and significant cases. It is unknown what Southern Water’s average spill rate will be for all its CSOs.
There are no simple answers and almost each case has a unique set of circumstances requiring tailored solutions. These range from pump optimization, increased holding capacity, sealing leaking pipes, slowing the flow with water butts and rain gardens, sorting misconnections and much more.
There is a long way to go!
2025 has been exceptionally dry so far so it remains to be seen if it betters the results for 2022 and if any of that is beyond the reduction in rainfall.