
Introduction
This SPS article is the latest in a series of website posts and newsletter publications following the Society’s analysis of available data pertaining to the release of untreated sewage into the waters of the Solent. The first article in this series can be found by taking this link.
For further explanatory background, please refer to the ‘Background context’ section at the end of the document.
SPS review of four years of Environment Agency data
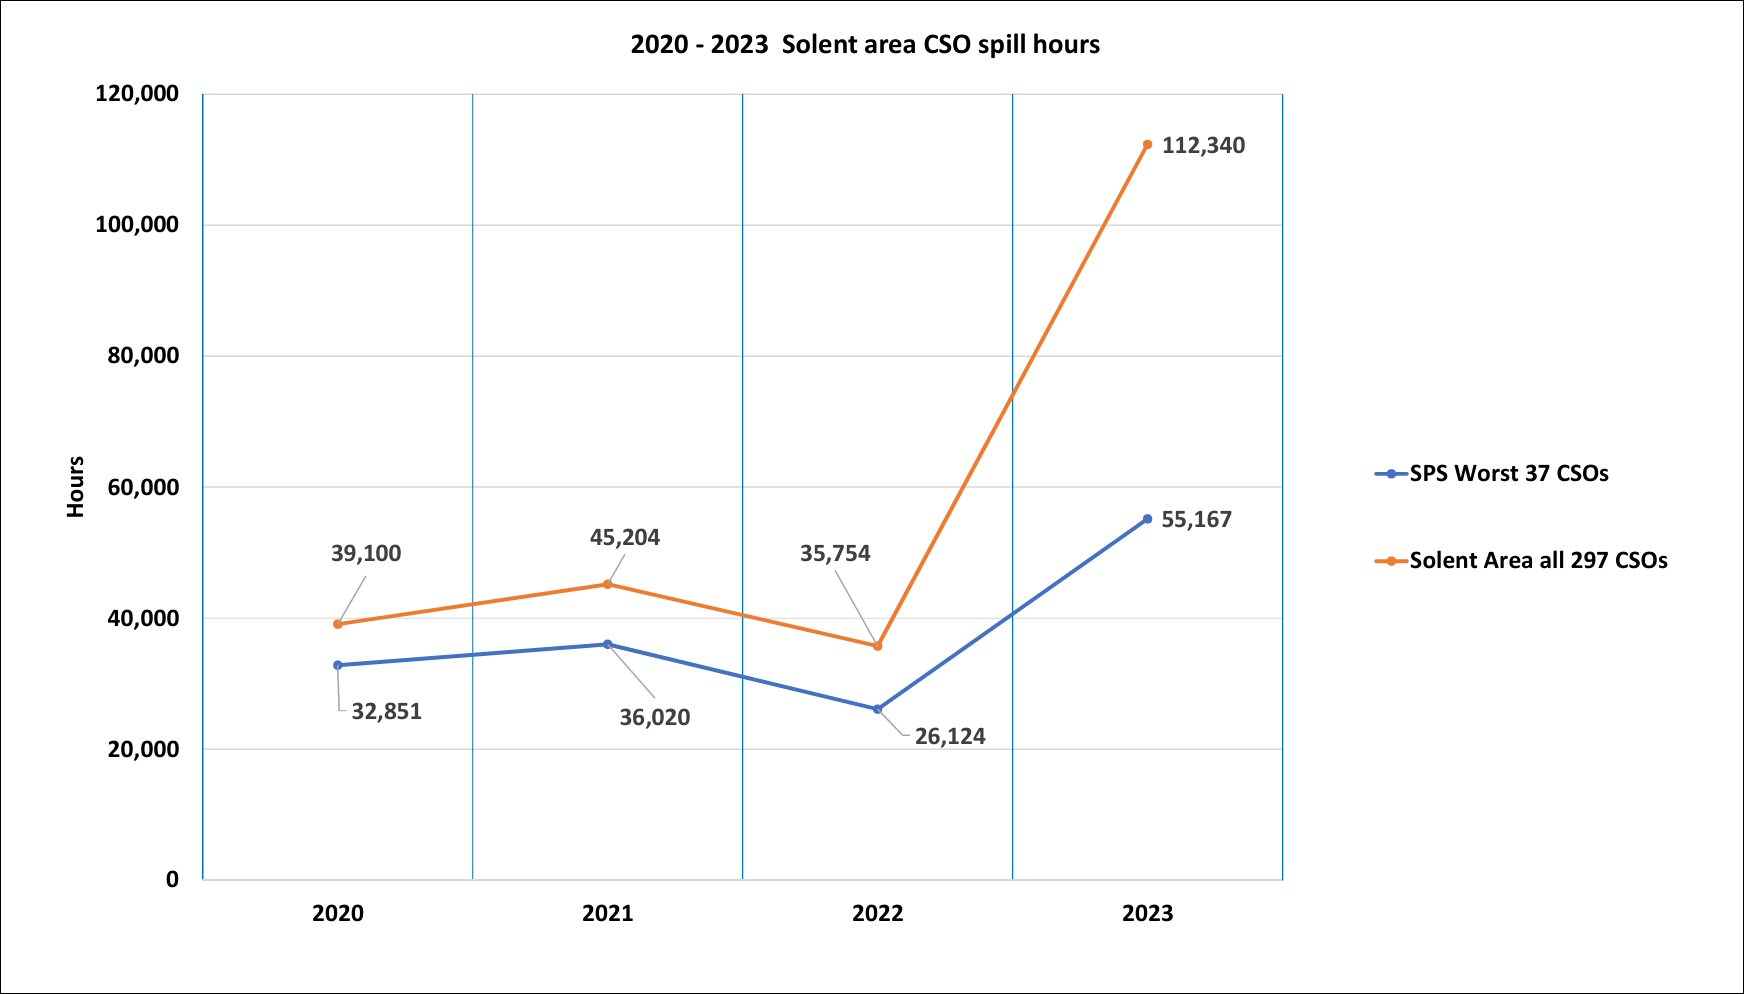
The latest data released by the Environment Agency show that the number of hours of spill from Combined Sewer Overflows (CSOs) across the Solent region increased very significantly during 2023, rising from an average of around 40,000 hours in each of the three preceding years to over 112,000 hours. That is an almost threefold increase.
Analysts at Solent Protection Society have been drilling into the data to see what’s been going on and how the story builds on our previous reports. For the past four years, we have been analysing the discharges reported from almost three hundred individual CSOs around the Solent identified in the data, determining the relatively small number of outfalls that are the worst offenders. In our previous reports, both in 2022 and 2023, we showed how just thirty-seven outfalls were responsible for almost 80% of the total sewage spilled. In each of those ‘worst case’ CSOs, the data for 2023 shows a similar significant increase as we detail later in this post.
It should be noted that SPS generally monitors CSO discharges into the tidal waters of the various rivers that feed into the Solent. However the state of the tide can affect discharges further up the river by holding water back or releasing it sooner. Where there have been significant discharges upstream which could impact the pollution into the Solent these have been included. This particularly affects the River Test into Southampton Water and the River Lavant into Chichester Harbour.
The tables shown in this post refer to ‘SPS Regions’, and to CSO locations within those regions. The fifteen regions noted are shown on the schematic map below, numbered generally by their rank within our ‘worst case’ set.
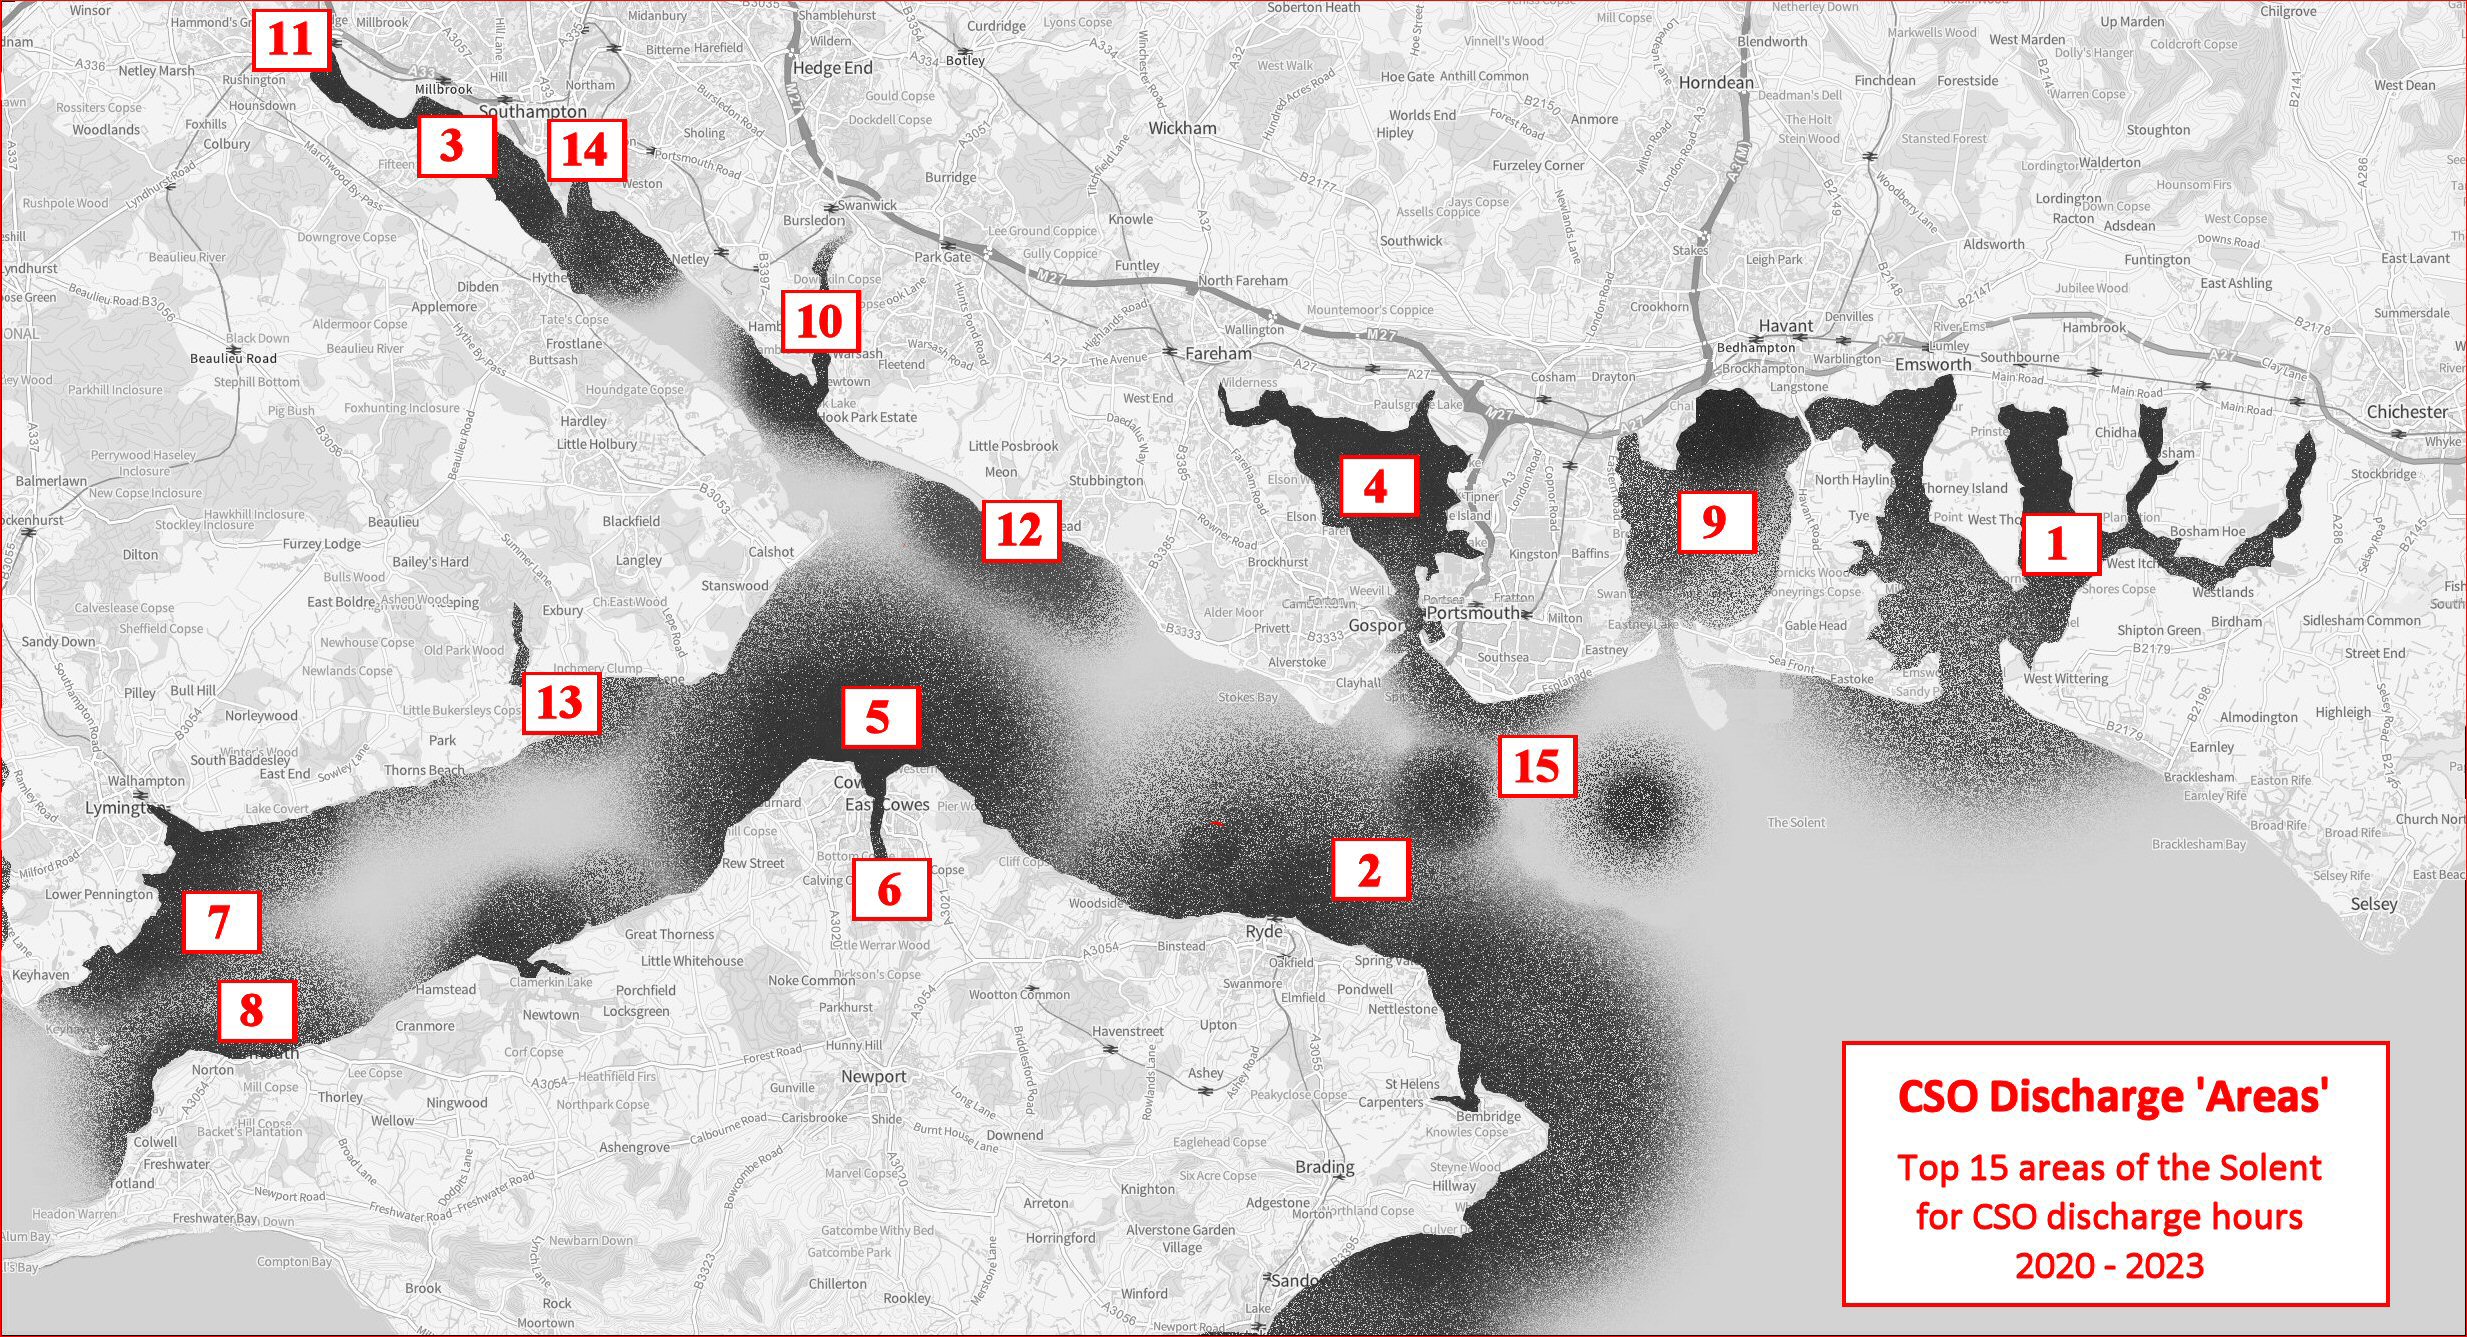
Once again, Chichester Harbour and the eastern Isle of Wight top the lists for the worst performance on CSO discharges. In our analysis, we have grouped the CSO discharge hours from the waste water treatment works (WWTWs) at Slowhill Copse, Millbrook and Portswood under ‘Southampton Water’. While these all flow directly into tidal river estuaries, the principal effect is on the body of Southampton Water.
We’ve brought together our findings from the previous three years and added the new data available for 2023 performance into a single chart below. We’ve broken this down in later charts to make it more readable.
Spillages at the thirty-seven ‘worst case’ have increased from an average of around 34,000 hours to over 55,000 hours, an increase of about 62%, rather less than the increase seen across the Solent-wide figures. There are several likely reasons for this, including the fact that the worst cases were already spilling heavily.
The increase in rainfall affecting the 2023 data has clearly resulted in an increase in the number of ‘worst case’, with the discovery of new offenders which had previously not been significant in the data. We discuss this further below.
Breakdown of CSO spill events at all identified CSOs across the Solent
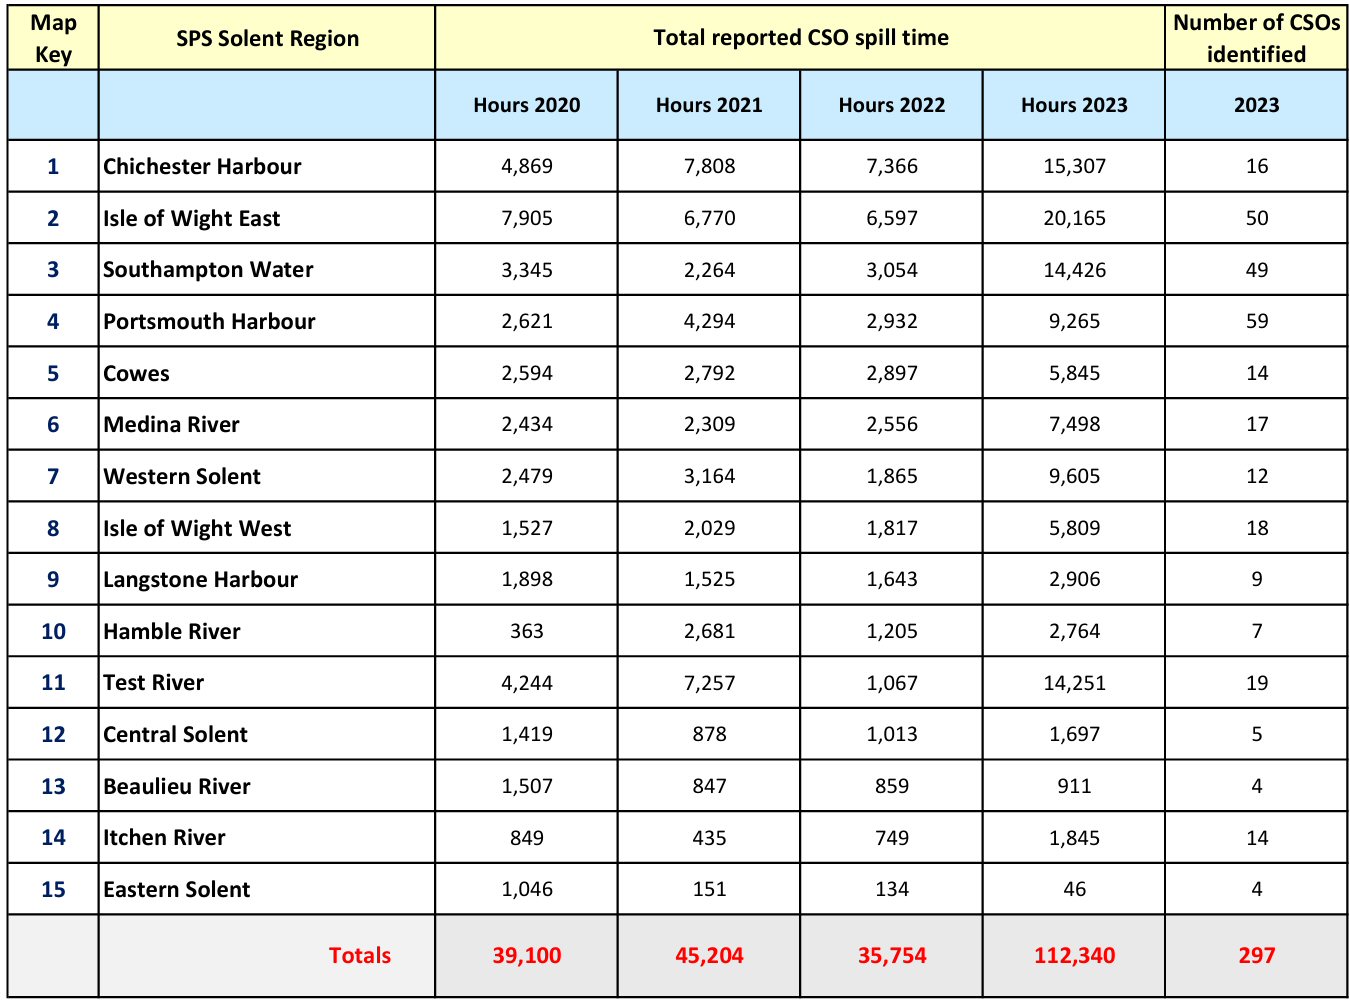
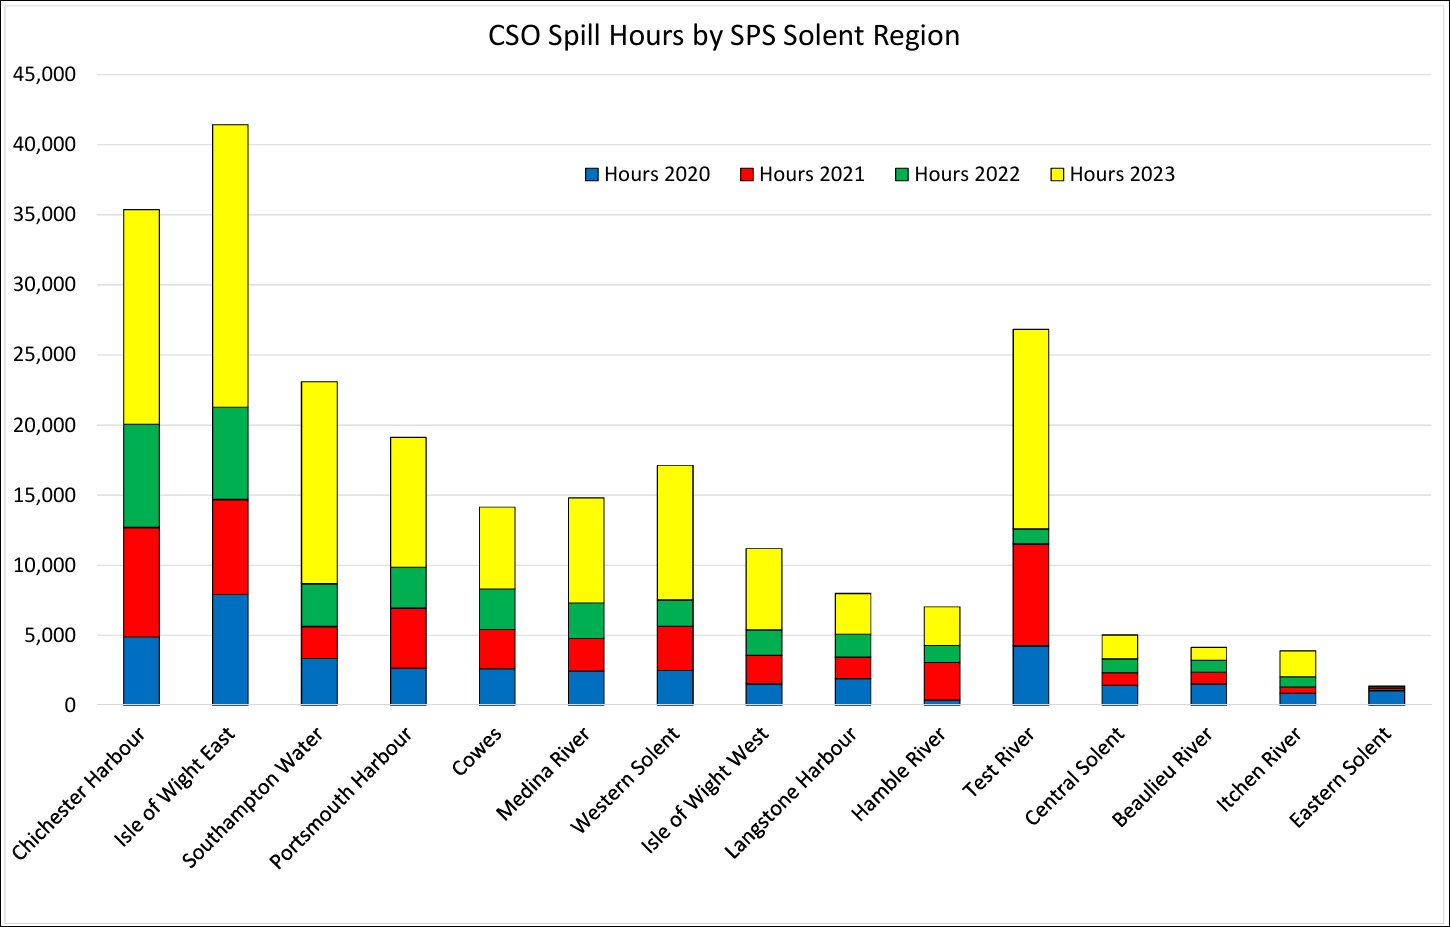
This first chart presents a set of Solent ‘SPS areas’ into which we have geographically grouped all of the CSOs identifiable in the Environment Agency data. The total number of hours of spillage is shown within each region by year, together with the sub-total number of CSOs within the area.
In the following chart, the data is presented in ‘stacked’ form, with the cumulative annual discharge displayed by each area highlighting the significant peaks at the Isle of Wight, Chichester Harbour and the River Test.
Breakdown of CSO spill events at the SPS ‘worst case’ CSOs across the Solent
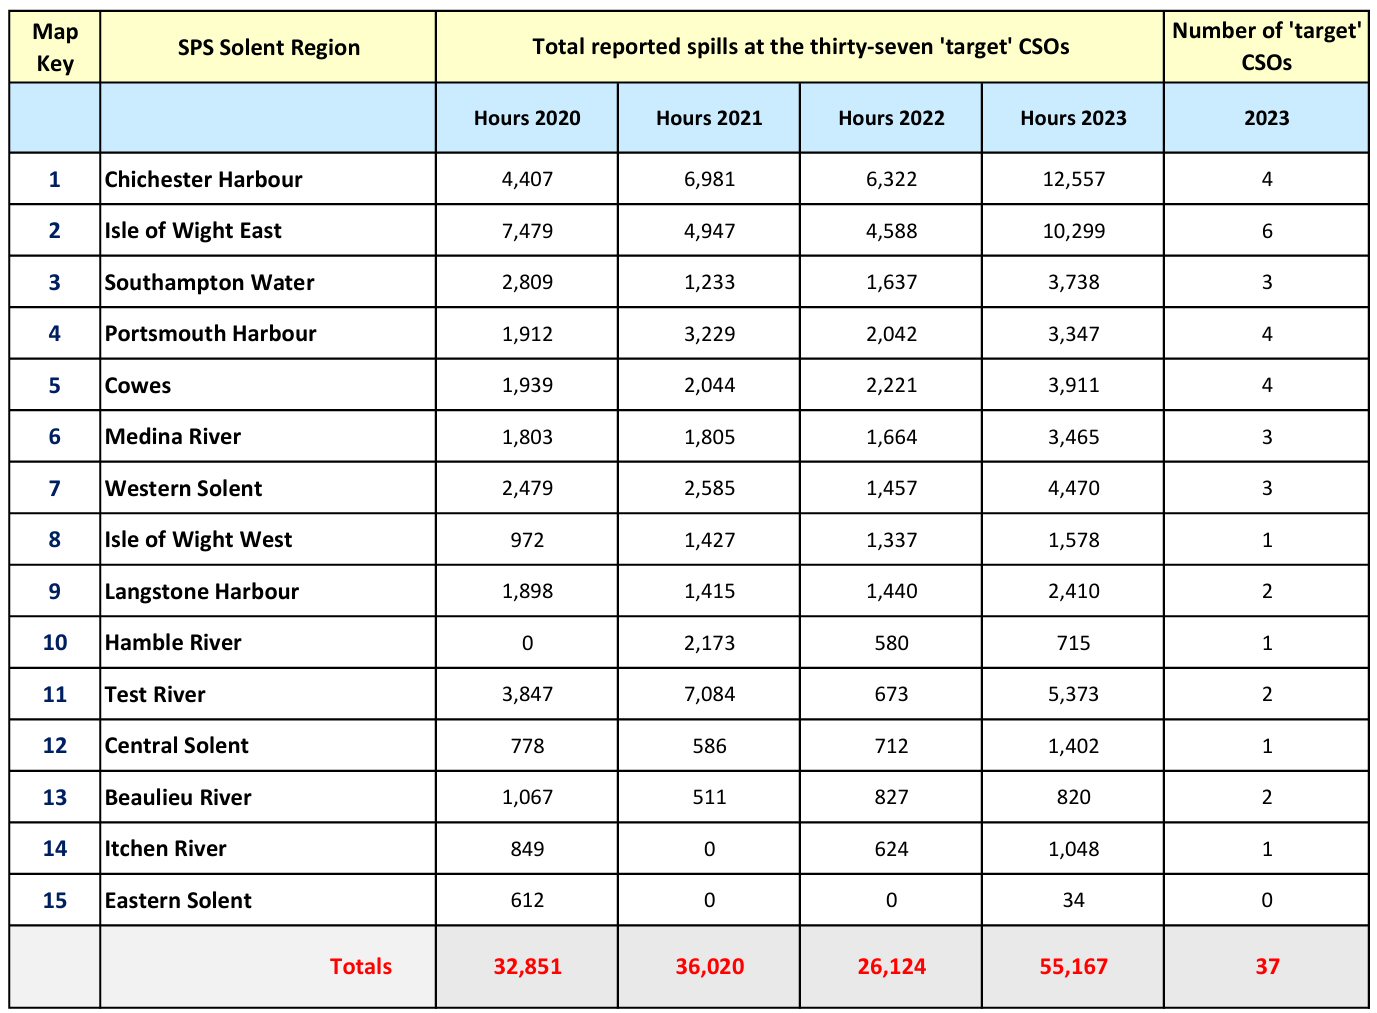
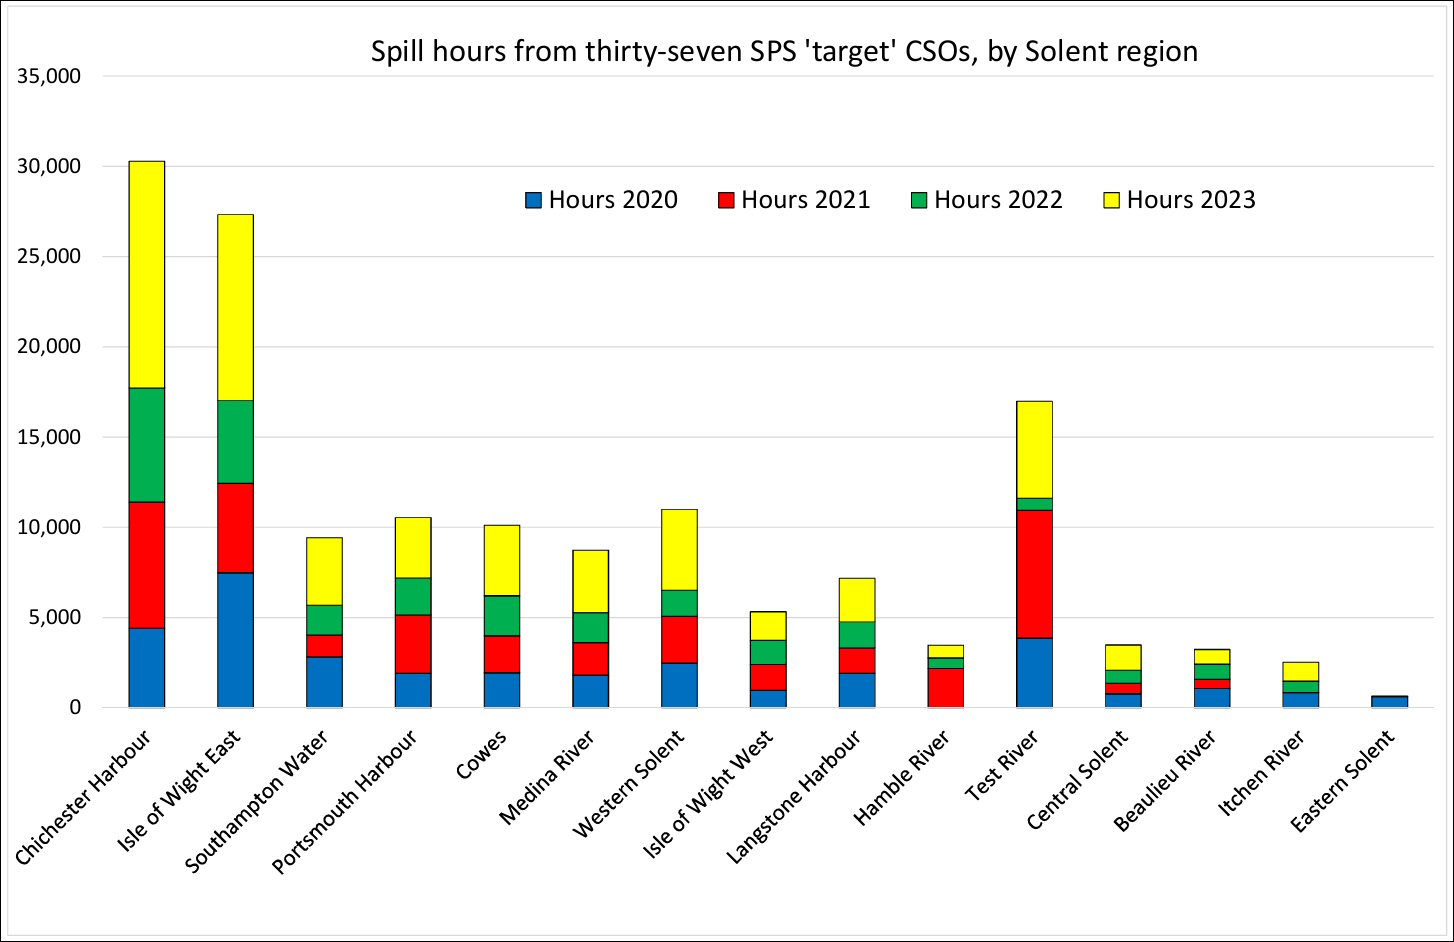
Looking just at the thirty-seven ‘worst case’ CSOs shows a rather different picture, with discharges into Chichester Harbour taking line honours over the eastern Isle of Wight. However, the Isle of Wight as a whole falls into the Sandown WWTW catchment and forms 35% of the worst case total Solent spills, with Chichester Harbour accounting for 23%. Between them, the fourteen Isle of Wight worst case CSOs and the four Chichester Harbour worst cases account for almost 60% of our total of the worst case CSO spills into the Solent.
As with the previous chart, the total number of hours of spillage is shown within each region by year, together with the sub-total number of CSOs within the area. Notice that we define the ‘worst case’ CSOs as ‘Targets’ in the following charts, suggesting that they are the ones for which remedial action would offer the greatest benefit.
And again, the same data displayed as a stacked bar graph:
The SPS Solent ‘Target CSOs’ – Four years of data
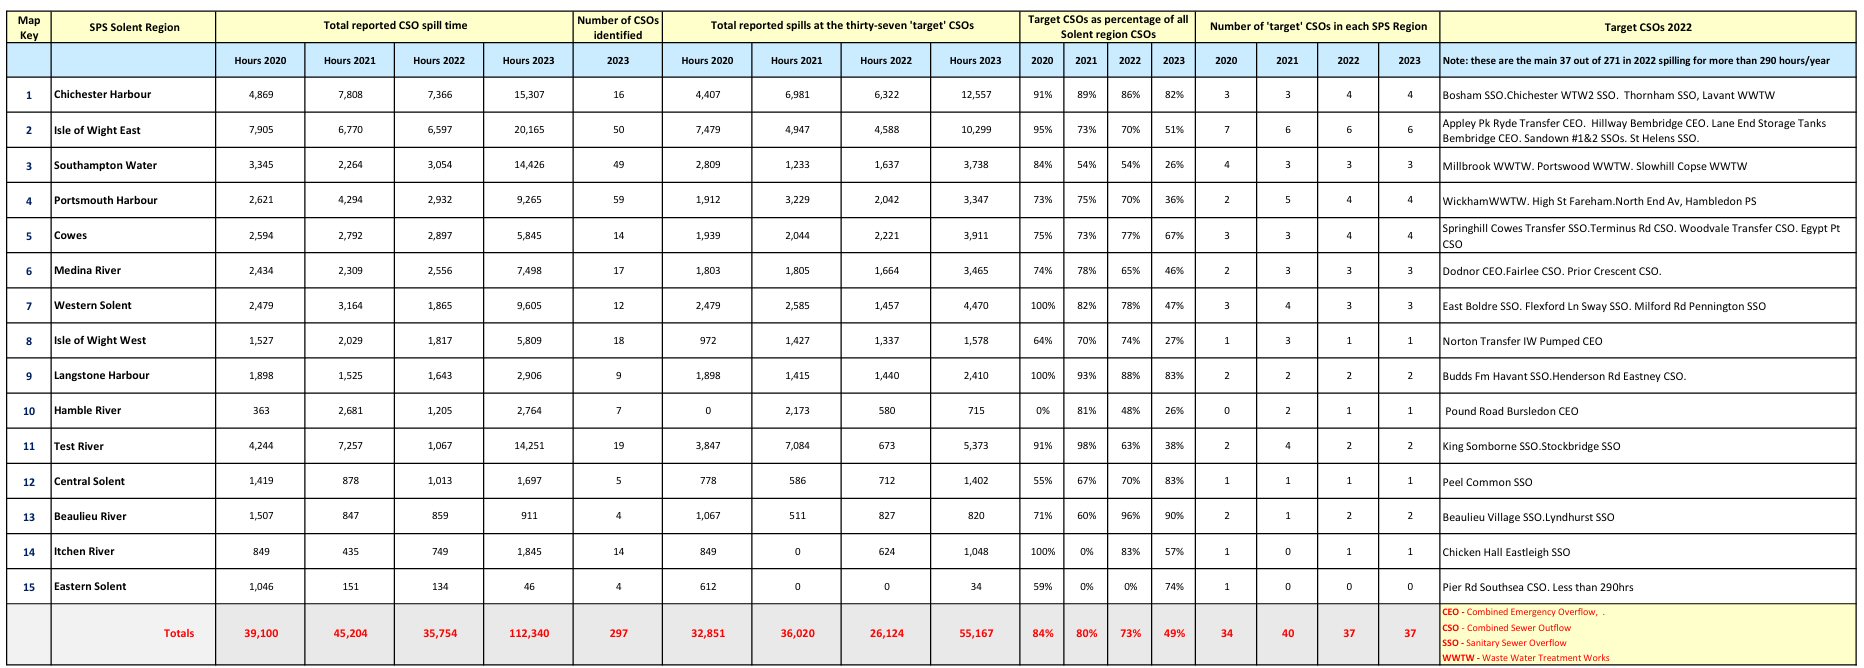
The next chart identifies the worst case CSOs in the right hand column. Note that the fluctuation in the number of target CSO’s identified in any one year results from assumptions we’ve had to make as some CSOs fall above or below the threshold of 290 hours per year we used in the Environment Agency annual publication.
As we explain in the ‘Background context’ section at the end of this post, the substantial increase in spills across the board in 2023 meant we have opted to retain the previous year’s thirty-seven ‘worst cases’ to maintain our comparison with the earlier years.
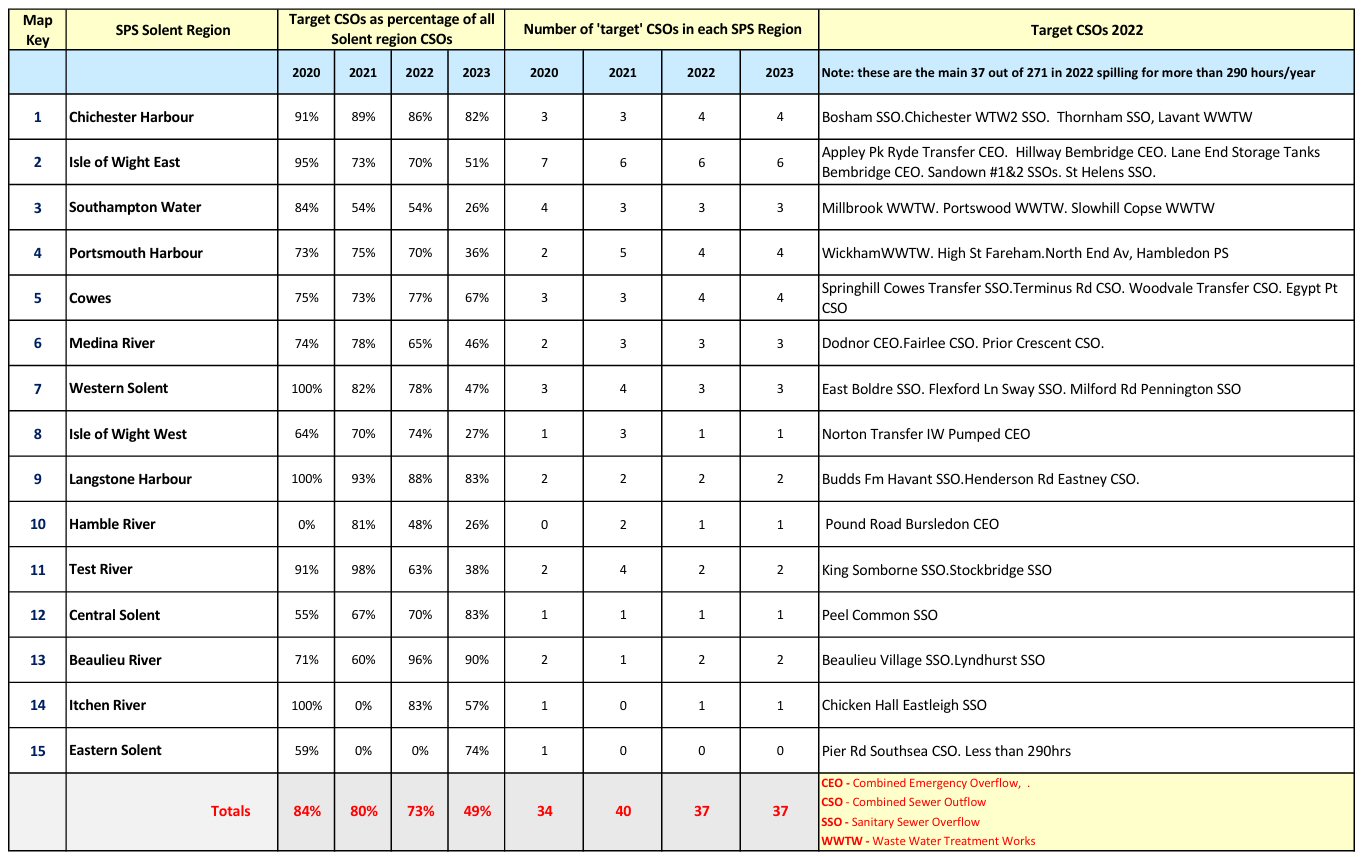
The percentage given in the chart is the relationship between the thirty-seven worst case hours and the total hours. It can be seen how the thirty-seven or so worst cases total an average of around 80% for years 2020-2022. That percentage drops in 2023 to just under 50% due to the exceptional spike in the data from a similar number of previously insignificant CSOs. That lower total of 49%, however, still shows that almost half of the total Solent spill duration comes from little more than a tenth of the CSOs discharging into the Solent.
Stormwater management
Stormwater is rainwater that is not absorbed into soil, flowing rapidly downstream and increasing the level of waterways and consequent volume in drainage. The significant increase in rainfall during 2023 reminds us that changes in rainfall patterns are expected in the coming years as a likely consequence of climate change. On many days, the rainfall in 2023 was exceptional, continuing over extended periods and resulting in saturated ground conditions. At these times, the rainwater entering the sewerage system has completely overwhelmed the capacity to cope, leading to many more hours of spill.
The Southern Water Pathfinder projects
We have learned through monitoring the Southern Water Pathfinder projects that it is not simply stormwater run-off that is entering and overloading the sewerage system. There is also a significant volume of groundwater entering the system below ground, through vulnerable joints in the pipes. The significance of this previously unrecognised inflow will have further implications on the way in which the problem of excessive CSO spills should be tackled in the coming years.
The Southern Water ‘Pathfinder’ projects are a set of trials being undertaken by the company to measure the effectiveness of different approaches to managing the influence of rainwater on the sewer network as well as maximise the network’s capacity, where possible. SPS has been closely monitoring the Isle of Wight pathfinder. For further details, take this external link.
Portsea Island stormwater management
It is, of course, possible that the reduction in significance of some of the original thirty-seven ‘worst case’ CSOs may reflect actions that have been taken by Southern Water. The locally infamous ‘Pier Road Southsea’ CSO in Old Portsmouth, has not exhibited significant spills since the 2020 data. However, given its position at the southern end of the densely populated Portsea Island, we continue to monitor it closely.
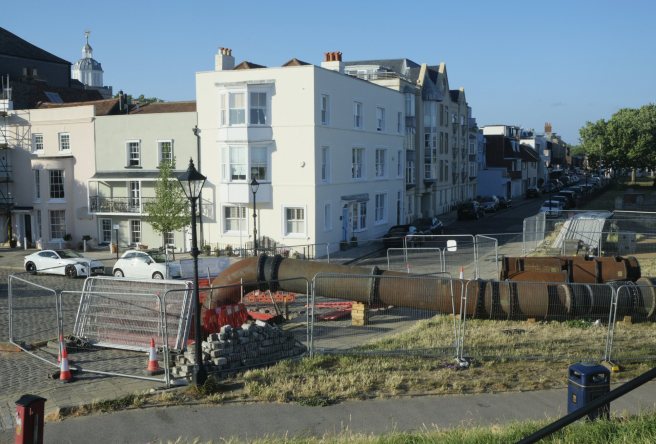
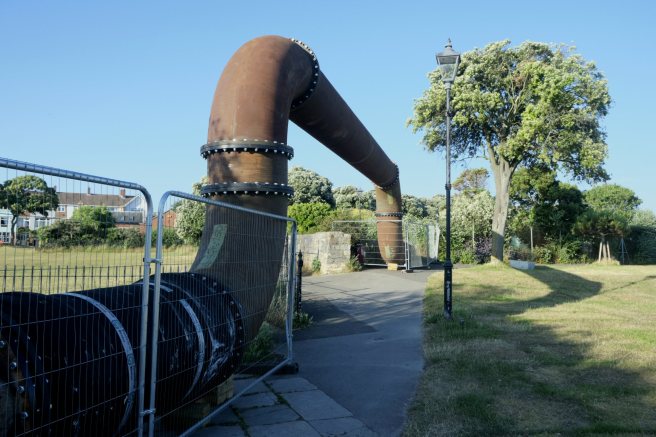
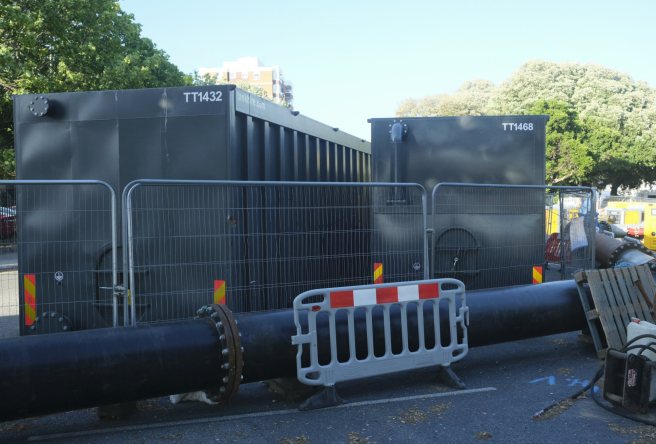
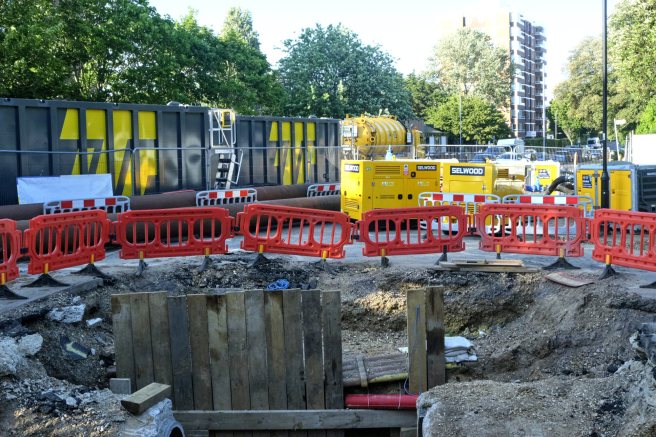
For the past four years, the nearby Pier Road pumping station has been under constant remedial action and during 2023 was the site of a massive pipeline operation with daily road tanker removals to Budds Farm wastewater treatment works at Havant. Despite repeated requests, no explanation for these works has been forthcoming from the company.
The ageing Victorian sewer network
Southern Water are making increasing use of emergency powers to expedite essential maintenance on older urban areas of the network, particularly in towns and cities such as Ryde and Portsmouth. Road closures on Portsea Island for sewer relining and reconstruction are becoming increasingly common, and when one of the only three routes into the city is affected, there is a significant peak time impact on traffic throughout the surrounding road network.
Use of the long sea outfall for stormwater discharges
The analysis SPS has undertaken assumes that when long sea outfalls discharge as a spill in Environment Agency data this is a combination of treated or untreated sewage and rainwater. Southern Water has considered the option to switch the routing of treated effluent and stormwater overflows between the Budds Farm CSOs into Langstone Harbour and the Eastney long sea outfall, but we suspect that more research is needed into the environmental impact of flow from long sea outfalls. Appley Road at Ryde has a long sea outfall into the eastern Solent but being remote form a wastewater treatment works is clearly untreated. Sandown, like Budds Farm on the mainland, is a treatment works with an associated long sea outfall.
Background context
Our aim, using Environment Agency data, has been to present a high level view of the ‘worst’ performing CSOs, our ‘targets’ for improvement, across the region. In doing this, we have demonstrated that the bulk of the discharge duration into the Solent results from a relatively small number of outfalls. Our benchmark for that number was initially set at 290 discharge hours per year, to generate a manageable number of ‘targets’ for presentation. For the first three years, that number fluctuated between 34 and 40, with a common set of thirty-seven ‘worst cases’ appearing; just over 10% of the total number of CSOs identified as discharging into the Solent.
The exceptional rainfall levels of 2023 triggered high discharge rates at previously insignificant CSOs, increasing the number of ‘worst case’ CSOs to around eighty above 290 hours/year. So to maintain the overall four-year comparison in this post, we have simply retained focus on the earlier thirty-seven.
It is important to bear in mind that water companies are not currently required to report either actual or estimated volumes of CSO discharges. The only data available relates to the date, start time and duration of a spill event. As has been widely publicised in the media, this could significantly under-call the actual scale of the discharge problem.
As far as possible we have tried to verify the Environment Agency data but there may be minor discrepancies, particularly if CSO names have changed, however we believe the overall trends are clear.

If you found this article of interest, please consider helping the Solent Protection Society, either through membership or by donation. We would welcome your support.
Please refer to the ‘Membership and Donations’ page.
