For the third year running Solent Protection Society has extracted and analysed the Environment Agency annual data on storm overflow releases into the Solent. There are some 300 storm overflows which the society has identified which discharge directly into the Solent, or into the tidal rivers and harbours that feed into it, for tens of thousands of hours per year. The results range between 35 and 45 thousand hours per year depending largely on how much rainfall occurs in each year, its intensity and the time of year. Summer storms falling on hard ground for example can produce very rapid water into the system.
But of these 300 combined sewer outfalls (CSOs), only around 12% account for an average of nearly 80% of the total number of hours spilled. In 2022 there were 37 outfalls which the Society believes are the worst cases and which should be given priority to drastically reduce the spills. They are broadly the same culprits in each of the three years.
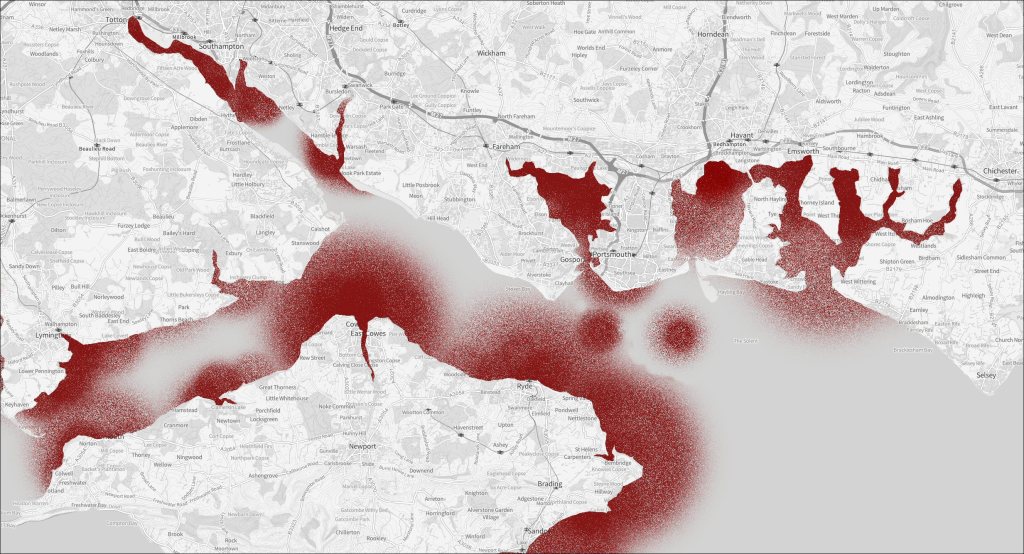
The distribution of raw sewage spills in 2022, detailed below and indicated in this graphic adds further weight to our request that Southern Water extend the coverage of its Beachbuoy spill notification web service to include the designated ‘shellfish areas‘ in the Solent, in addition to the set of ‘bathing water beaches‘ currently covered. For further details, please refer to this SPS website post from November 2022.
The worst cases
Of the 15 Solent Areas the Society has looked at, the north and east shores of the Isle of Wight taken collectively account for nearly 40% of all the spills into the Solent by hours run or ‘duration’ as it is known in the water industry. This is known as the Sandown Catchment as the Island has an interlinked combined sewer system that connects all the main population areas back to the treatment works at Sandown. It includes everywhere from Totland in the west to Cowes, Fishbourne, Ryde and Bembridge round to Sandown in the southeast. There are 14 CSOs which spill for more than 290 hours per year, with an average closer to 1000 hours per year.
The second worst area is Chichester Harbour which alone accounts for over 20% of the spills and is a particularly environmentally sensitive area as well as being important for leisure activities. There are four principal culprits in the 2022 data: Bosham, Chichester, Lavant and Nutbourne.
To their credit, Southern Water recognised the problem with the Isle of Wight system which had worked well when first constructed over 30 years ago. At that time, many small but inadequate treatment works were taken out of use and all waste was instead pumped to Sandown. The seas were cleaned up significantly, but increased development and climate change have defeated that system such that it now overflows in all areas as soon as it rains.
Southern Water have been implementing a £10m ‘pathfinder’ project on the Isle of Wight to ‘slow the flow’ of rainwater where it falls, delaying its entry into the drainage system. There is a long way to go yet but the Society is supportive of the project and remains in close contact with the team. There is more information about this work on the Southern Water website. We believe that the £6m ‘South Downs and Harbours’ pathfinder project referred to by Southern Water on that page is being extended to address the excessive discharges into Chichester Harbour highlighted in our report, below. There is little information available yet though we suspect that the company will be adopting the approaches followed on the Isle of Wight, slowing or preventing ground water from entering the sewer network.
The detailed results
The chart below shows the 15 Solent areas over each of the 3 years and the number of hours that spills ran in each area. They are ranked 1-15 in order of spills in 2022.

Chart explanation, reading from the left:
Rank 2022: The 15 Solent Areas ranked in descending order based on the 2022 data, showing Chichester Harbour as the worst offending area with 7,336 hours of spills.
Total Spill Hours: The total hours spilled by the areas’ CSOs , shown by the past three years, 2020, 2021 and 2022.
# of CSOs: The total number of CSOs identified within each area in 2022.
Worst Cases – Highest spilling ‘target’ CSOs within each area
Subset of total spills: The total spill hours for the worst cases or ‘target CSOs’ in each area, shown by year
% of total spills: The percentage of the area’s total spills represented by the target CSOs in each respective year.
# of target CSOs: The number of target CSOs within each area, shown by year
Target CSOs in this Solent area: The identity of the actual target or worst case CSOs in each area. These are the Environment Agency (EA) Site names which often refer to the WWTW (waste water treatment works) involved. The actual outfall may have a slightly different site name description used by the WaSC (water and sewerage companies). The chart generally uses the EA site name, but we have access to the WaSC site name if necessary.
At the bottom are the totals for each year from which the figures quoted above are taken. There are also the cumulative figures for the Isle of Wight and Chichester Harbour.
CSOs can go by other names and the acronyms for them are listed to the right at the bottom of the chart.
In summary
The subject of excessive discharges of raw sewage into Britain’s rivers and waterways continues to receive high coverage in the national press, applying continued pressure on the the water companies, the Environment Agency and the regulatory bodies, all of which need to take concerted and urgent action to bring about the improvement that the bill-paying public demand. While there are national campaigning groups such as The Rivers Trust and Surfers against Sewage who continue to apply pressure at the UK-wide level, Solent Protection Society will continue to analyse the detail in the data as it applies within the tidal waters of the Solent.
It is important to understand that by focussing on discharges into the rivers and estuaries at or below the limit of influence of the tide, we are only displaying part of the picture. The real state of discharges into Solent waters will be significantly worse. By way of example, our totals ignore the following small sample of upstream CSOs, each of which spilled eventually into Solent waters during 2022.
| CSO location | spills (2022) | Discharges to | Eventual Destination |
|---|---|---|---|
| Roud WWTW | 890 hours | River Yar (Eastern) | Bembridge Harbour |
| Calbourne WWTW | 531 hours | Caul Bourne | Newtown Harbour |
| Redlynch WWTW | 1,178 hours | River Blackwater | River Test |
Further reading
[Updated – June 9 2023]
| BBC, June 9 2023 | “Drugs, pesticides and medicine found in south coast seawater” |
| The Guardian, May 27 2023 | “30 water treatment works released 11bn litres of raw sewage in a year, study suggests” |
| BBC, May 18 2023 | “Sewage spills: Water bills set to rise to pay for £10bn upgrade” |
| The Times, March 26 2023 | “Raw sewage dumped into English waterways 800 times a day“ |
| The Times, February 13 2023 | “Leader – The Times view on cleaning Britain’s water: Dirty Business” |
| SPS website, Jan 24 2023 | “Southern Water demonstrates the positive PR value of remote monitoring of its distributed assets” |
| SPS website, Nov 17 2023 | “Southern Water’s Beachbuoy scope should be extended to highlight all Solent discharges“ |
| SPS website, Dec 4 2021 | “Analysis of more than 40,000 hours of sewage discharge into the Solent during 2020” |
If you found this article of interest, please consider helping the Solent Protection Society, either through membership or by donation. We would welcome your support.
Please refer to the ‘Membership and Donations’ page.
